FUNDING RATES
PUBLISHED: 2025-01-15
CATEGORY: Knowledge Base
Funding rates in cryptocurrency markets refer to the periodic payments made between traders in perpetual futures contracts to ensure the contract price aligns with the spot market price of the underlying cryptocurrency.
This is a powerful indicator that shows when market is overheated and when it is too pessimistic that creates a great buying opportunity.
What are the funding rates for?
In short, funding rates is a balancing mechanism, ensuring that the prices of your perpetual swap contracts do not stay too far from the underlying asset's spot prices, such as Bitcoin or Ethereum.
Funding rates act like a small market fee that helps balance digital asset trades. They ensure the market doesn’t lean too heavily toward those expecting price increases (long positions) or those betting on price declines (short positions), maintaining harmony.
Explained simply, funding rates are a way of helping balance the market by adjusting the cost of holding long and short positions in futures contracts. For example, if a disproportionate number of traders bet on the price of Bitcoin increasing, the funding rate might increase, making it more expensive to hold a long position in BTC.
In contrast, if the majority expect Ether prices to fall and take short positions, the funding rate might decrease, making it less costly to hold a long position. This mechanism ensures that no single betting strategy overwhelms the market, maintaining balance and fairness among all traders.
There are positive and negative funding rates. When it is the former, traders with long positions pay a fee to those with short positions. On the other hand, when the signal shows negative funding rates in the crypto market, short position holders pay an additional charge to those with long positions.
Therefore, to maintain price alignment in the absence of periodic settlement, centralized crypto exchanges will make use of funding mechanisms, which adjust periodically based on market conditions.
Calculating Funding Rates in Crypto
Besides having crypto funding rates explained in general terms, it's also important to understand how to calculate them. For that, you'll need two main components: interest rate and premium index. Their roles in crypto futures funding rates can be explained below:
Interest Rate: Mirrors the cost of capital set by the crypto exchange and the general borrowing costs applied in the market.
Premium Index: This index tracks the price divergence between perpetual futures contracts and spot.
P = Average Perpetual Price − Average Spot Price
These two elements work together and aim for the same goal: keeping futures contract prices close to the spot price. Understanding their indicators will help you grasp real-time signals in the market.
Let's say when the futures contract trades above the market price, then the market is bullish – or when traders are more greedy and aggressive with their investments.
But, if it trades below the market price, then the market is slow or bearish. In other words, it does not look interesting for traders to act on their investments.
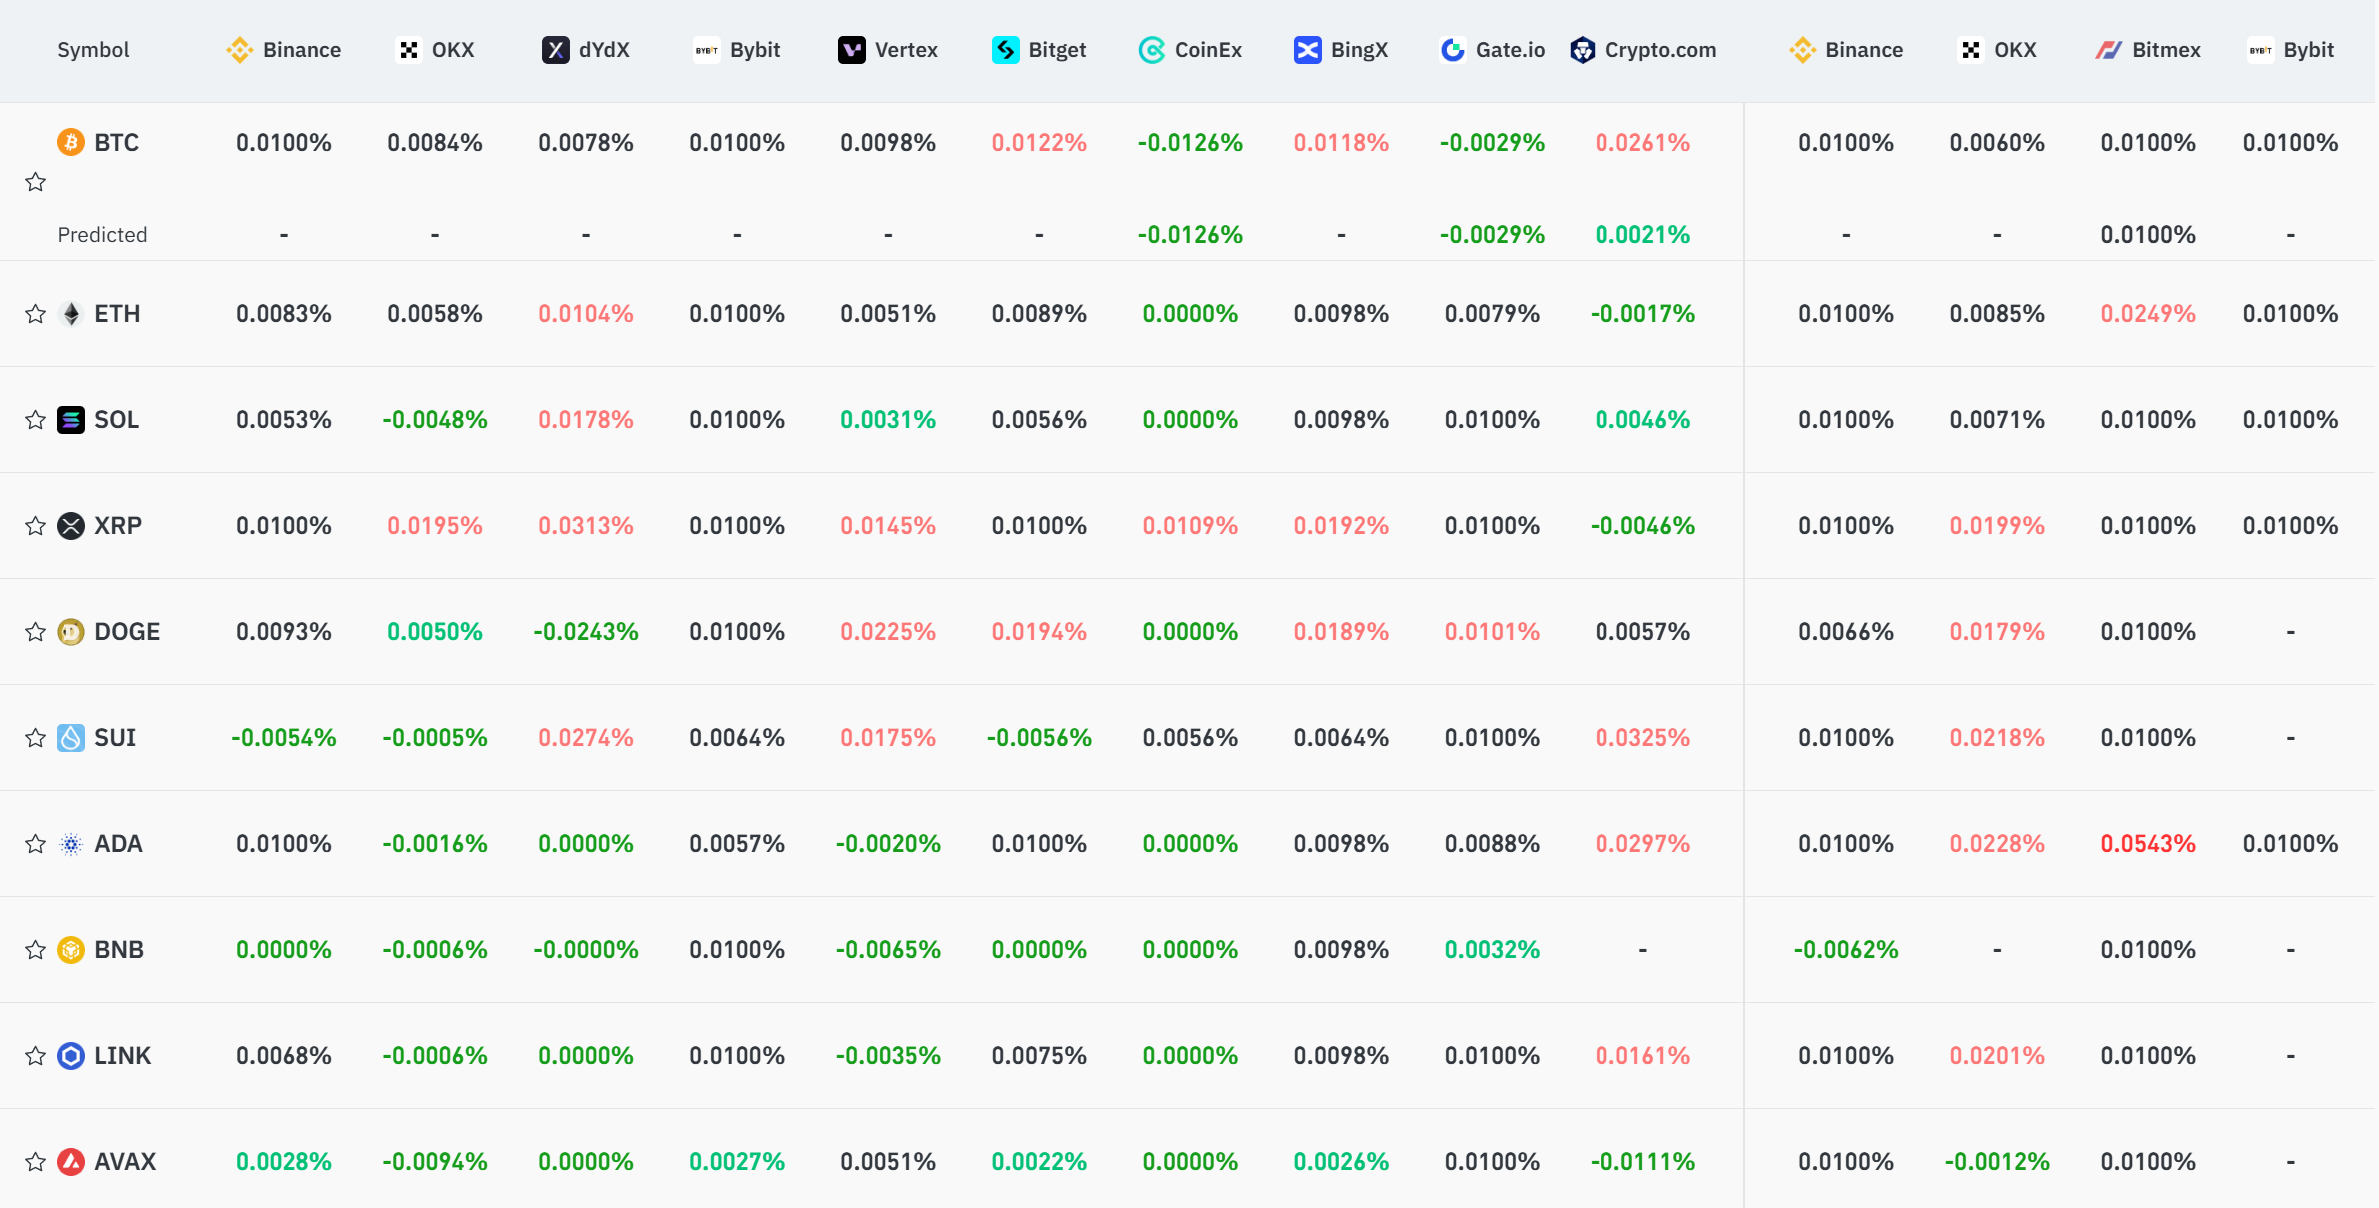
In the image to the right you can see different funding rates on different centralized exchanges. Red and green show positive or negative change compared to previous period and the sign determines who pays to whom.
Funding rates are updated every 8 hours.
How funding rate is calculated
Now, let's see how funding rates really play out in calculation.
Step 1: Find the difference between the futures and the spot market prices.
Step 2: Determine the percentage difference between the futures and spot prices. If it's below zero, then the results would be negative funding rates in the crypto market or the contrary.
Step 3: Set the funding rate as a fraction of the discrepancy rate.
Step 4: Charge the calculated funding rate as a fee to the trader's account.
Example
Let's say:
- The average perpetual contract price for Bitcoin over the last hour is $40,000.
- The average spot price over the same period is $39,900.
- The interest rate for the funding period (assuming 8 hours) is set at 0.01% (0.0001 in decimal form).
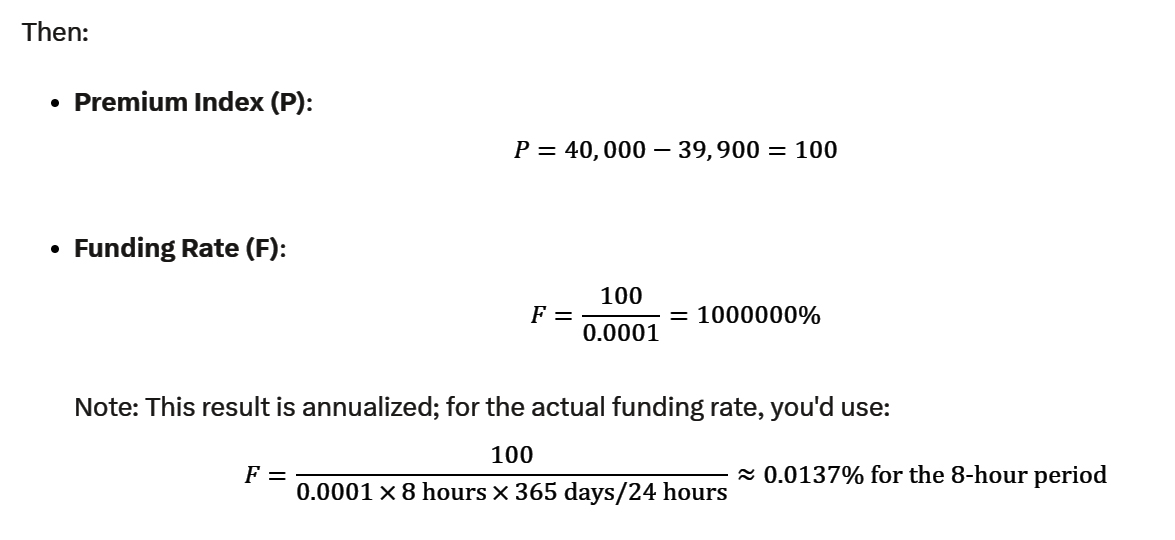
This simplified example shows positive funding where long positions would pay short positions. Remember, actual implementations might include additional factors or slight variations in how premiums and rates are calculated.
How to interpret funding rates signals
Understanding why the funding rate exists requires delving into the unique nature of perpetual futures contracts. When you purchase cryptocurrencies like Bitcoin or Ethereum in the spot market, no funding fee applies. Similarly, traditional futures contracts don’t involve a funding fee. Instead, they have premiums or discounts, often referred to as contango or backwardation.
Perpetual contracts stand out by trading continuously without expiry. The goal is for them to closely shadow the spot market price, thereby eliminating the premium/discount dilemma present in normal futures contracts. This is achieved through the funding rate mechanism.
If the futures market trend deviates from the spot price — trading at a premium or discount — the funding rate acts as an incentive to steer the price back to parity with the spot price.
general conseption
High funding rates make holding long positions expensive, while low or negative ones discourage short selling. Traders must consider these costs as they directly impact profitability, especially in volatile markets.
Next up, understanding what are funding rates in crypto is just as important as understanding how they are linked to market sentiments. They generally suggest bullish sentiment, with most traders holding long positions. Conversely, negative funding rates in crypto often indicate bearish sentiment, with more traders expecting prices to drop.
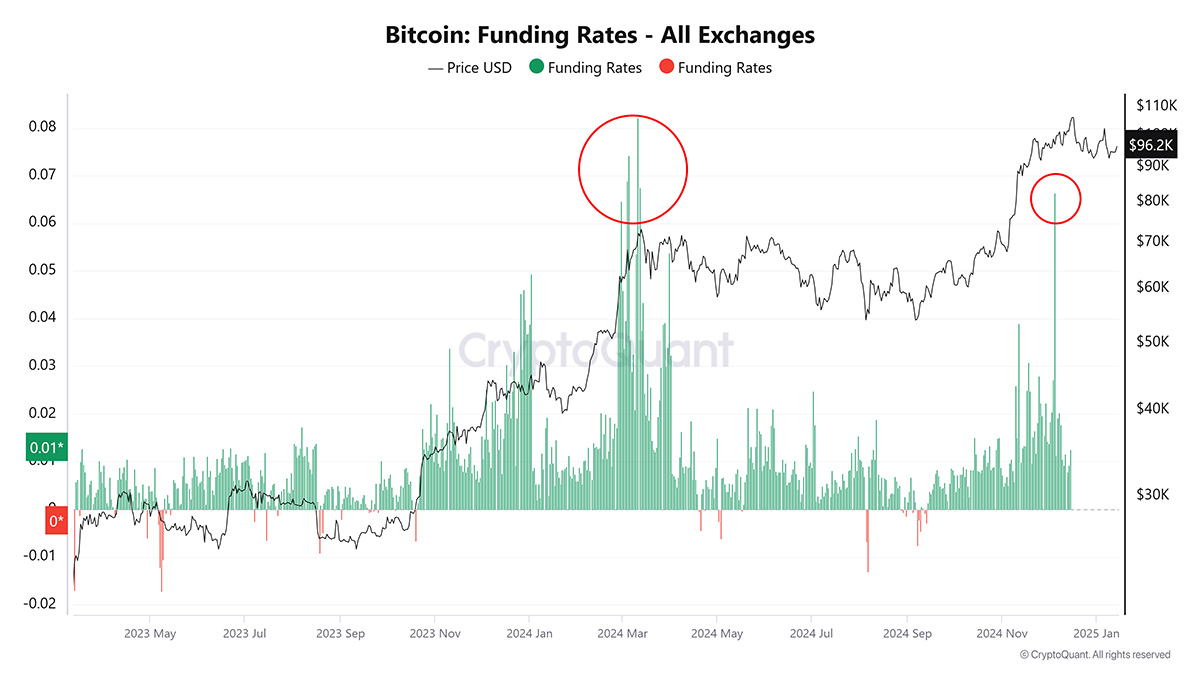
The funding rate is an excellent indicator for gauging market sentiment in actual trading. Extreme changes in the funding rate often reflect an overextension of market sentiment. Extremely high positive funding rates indicate that the market is overly optimistic, while extremely negative funding rates suggest the market may be in a state of panic.
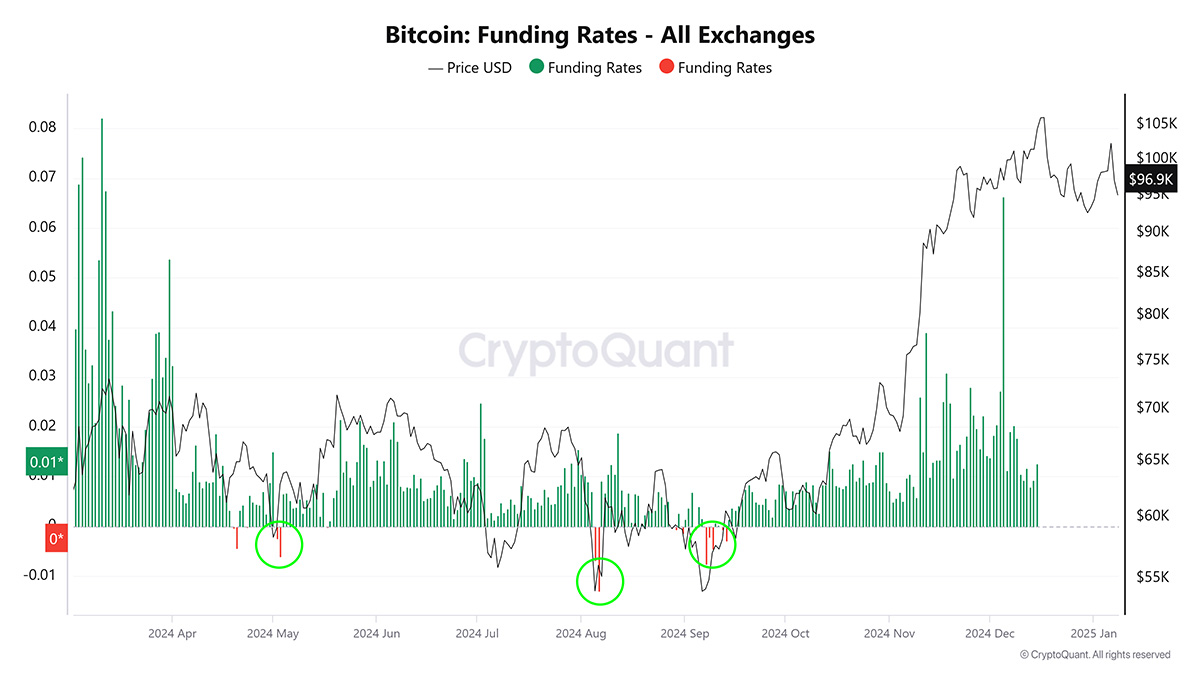
In such situations, a price reversal could occur, making extreme funding rates a potential signal for contrarian trading. When the funding rate reaches these extremes, it may provide an opportunity for traders to consider positioning against the prevailing trend.
The chart on the left illustrates that when BTC reached its highs, the funding rate was extremely high and positive (red circles), indicating that the market was over-optimistic, and a prolonged shock correction in BTC ensued.
At the same time when there is a bull market phase it is wise to use negative funding rate days to buy asset. As you can see on the chart above, green circles show best time to buy BTC. This is the time of negative funding rate days, that give good entry points.
Funding rate Heatmap
A Funding Rate Heatmap is a graphical representation used in the cryptocurrency futures market to visualize funding rates across different cryptocurrencies, trading pairs, or time periods.
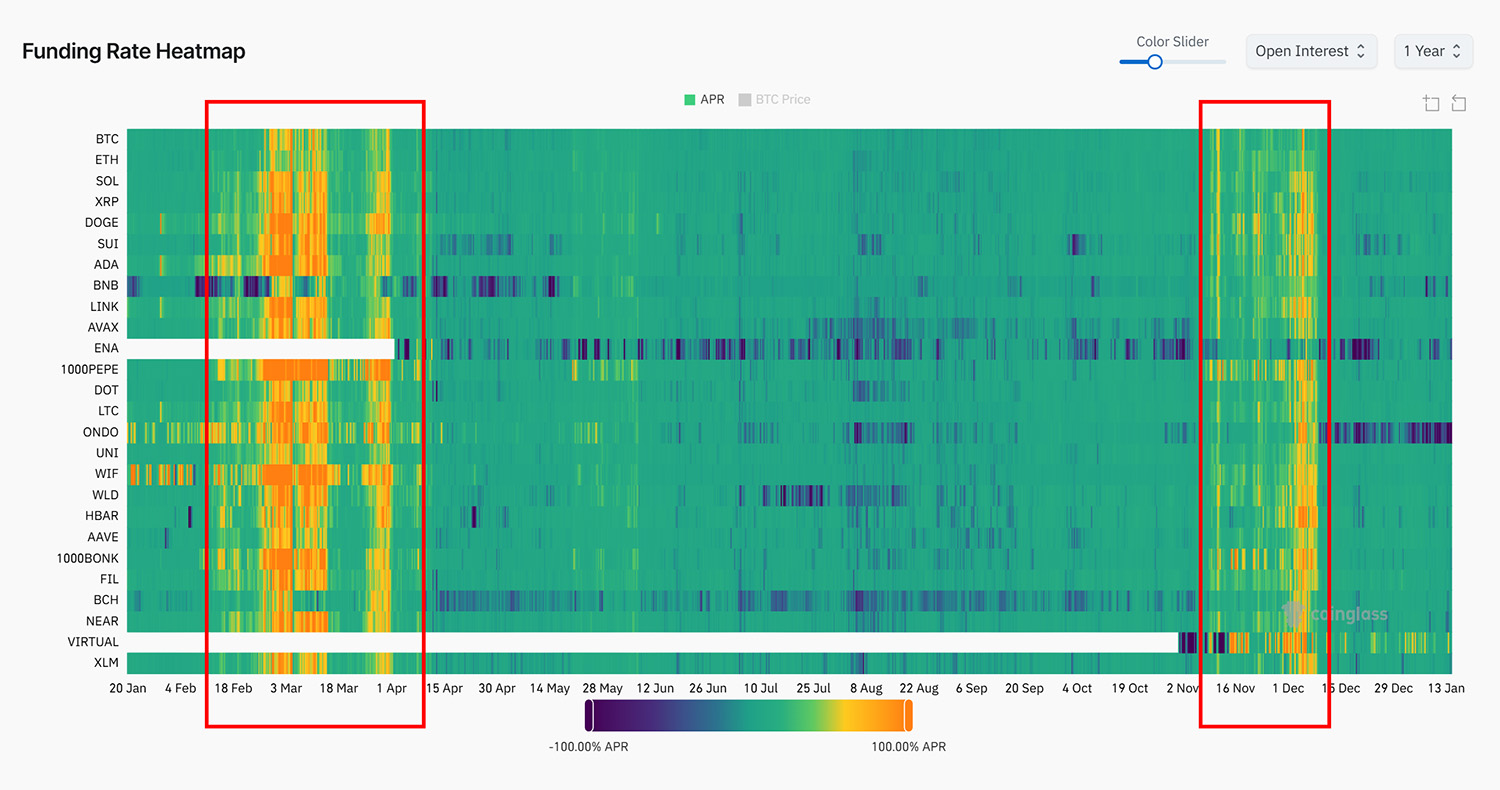
It is vital for determining if the market across different altcoins are overbought or oversold. It is however more useful for overheated state rather for oversold conditions.
When a box turns fully orange, it means long traders are paying 100% or more of their entire position size per year in funding rates. For example, trader would need to cough up $100,000 per year in funding fees to stay in his 100X leverage long position (assuming the same 8-hour funding rates will stay the same throughout a year).
But when a box is greener, funding rates are closer to zero. And when it starts turning purple, trader would be collecting funding fees from short-sellers (assuming he isn’t liquidated beforehand, that is).
The general rule is when funding rate heatmap begins to burn, that is becoming more and more orange, the possibility for longs to be liquidated increases. This usually happens when the market is overheated and potential correction is due.
However, pay attention to the fact that elevated funding rates can stay elevated for longer than you may expect. In order to make decisions you should find confluence within several indicators.
As you can see in the image on the left red boxes show the time when market was overheated on most tradable assets. These times are good indication of that perhaps you should at least consider profit-taking. Usually when map gets back to greenish colors after the burn it is a good time to fix more profits.
Conclusion
In conclusion, understanding crypto funding rates is crucial for anyone engaged in trading perpetual futures contracts as well as just crypto spot trading. These rates not only reflect the current market sentiment but also serve as a mechanism to align futures prices with the spot market, preventing significant discrepancies. Whether you're a seasoned trader or a newcomer to the crypto trading scene, the insights provided by funding rates can guide your trading strategy, from spotting potential market corrections to identifying arbitrage opportunities.
The visualization tools like funding rate heatmaps offer a panoramic view of market dynamics across different cryptocurrencies and time frames, making complex data accessible and actionable. However, while funding rates are a powerful indicator, they should be part of a comprehensive trading strategy that includes a mix of technical analysis, fundamental research, and market news. By paying attention to these rates, traders can better manage risk, optimize their positions, and potentially enhance their trading outcomes in the ever-evolving and often volatile cryptocurrency markets. Remember, in the world of crypto trading, knowledge, and adaptability are your best allies.
Disclaimer: This statement does not constitute financial advice. The information provided is for informational purposes only and should not be considered as investment advice. If you require financial advice, please consult with our certified financial consultants who can offer personalized guidance based on your specific financial situation.
#funding #rate #heatmap #analysis #crypto
COMMENTS • 2


ImpulseTrade 2025-01-15 | 19:50:59
If you are talking about the 4-year cycle than it is better to use funding rate indicator in conjunction with other indicators that show the top, such as pi-cycle, MVRV-Z score and others.

Elmango 2025-01-14 | 19:46:13
I always use heatmap to track the overheat situation in the market. Very useful, I think it will be really handy for other people to know how to use it, especially with conjunction to other indicators.
John 2025-01-15 | 14:01:29
Could you please tell if this indicator can be used to track the crypto cycle top? And how long can the market be overheated, that is funding rates are at extreme levels? Thanks.