TRADING SIGNALS AND COPY TRADING
Follow structured entry, stop-loss and exit signals with transparent performance tracking and a success fee charged only on realized profit.
ImpulseTrade copy trading provides systematic trading signals generated by a proprietary algorithmic indicator.
ImpulseAlgo™ is not just another copy trading platform; it's your ticket to potentially profitable trading with minimal effort. Our service leverages the power of the ImpulseAlgo™ Indicator, a proprietary tool developed by our team of expert traders and software engineers. This indicator is designed to identify market trends with unprecedented accuracy, turning insights into actionable trades.
We understand the importance of protecting your capital. The ImpulseAlgo™ Indicator includes risk assessment features, ensuring that trades are not only potentially profitable but also balanced against risk. Every trade is secured with stop-loss order.
Once the ImpulseAlgo™ Indicator identifies a trading opportunity, our system automatically sends the message to telegram group. You simply open position on your account as shown on the example below.
Here is the example of how the trade is executed:

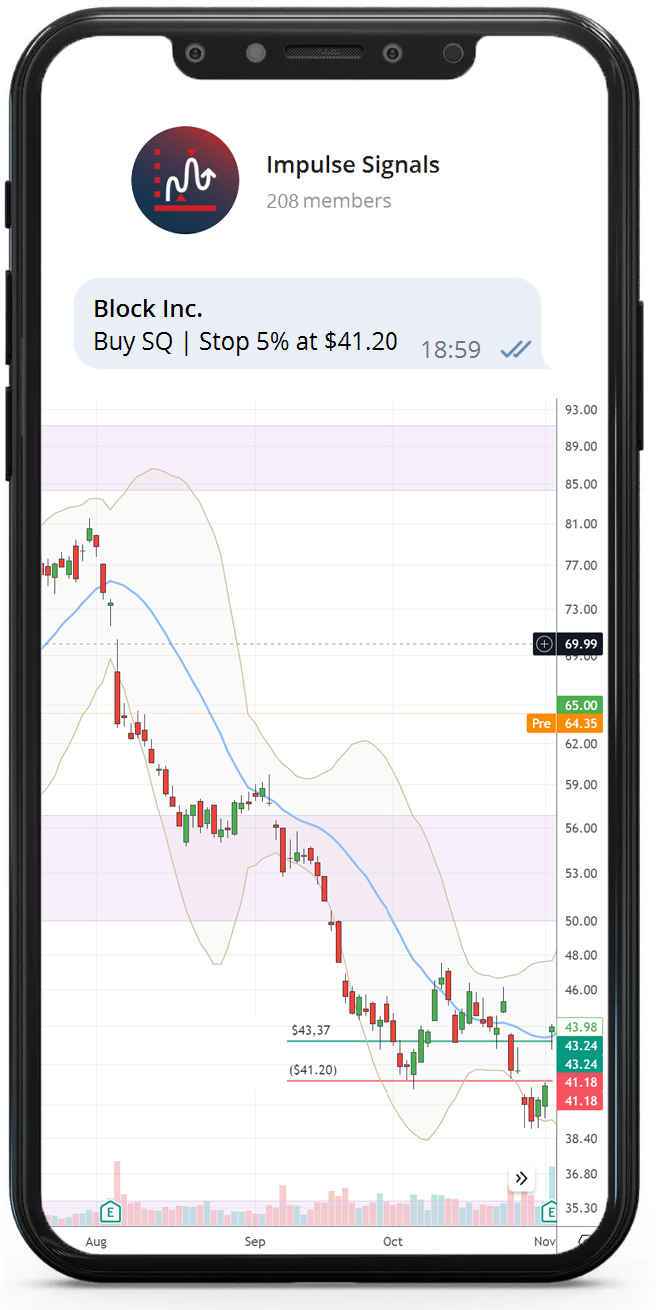
You get the message in Telegram to buy SQ at current price of $43,37.
You buy the asset, the quantity is up to you, depending of your net worth, and you put the stop-loss 5% below the entry price, in this example stop-loss should be placed at $41,2.
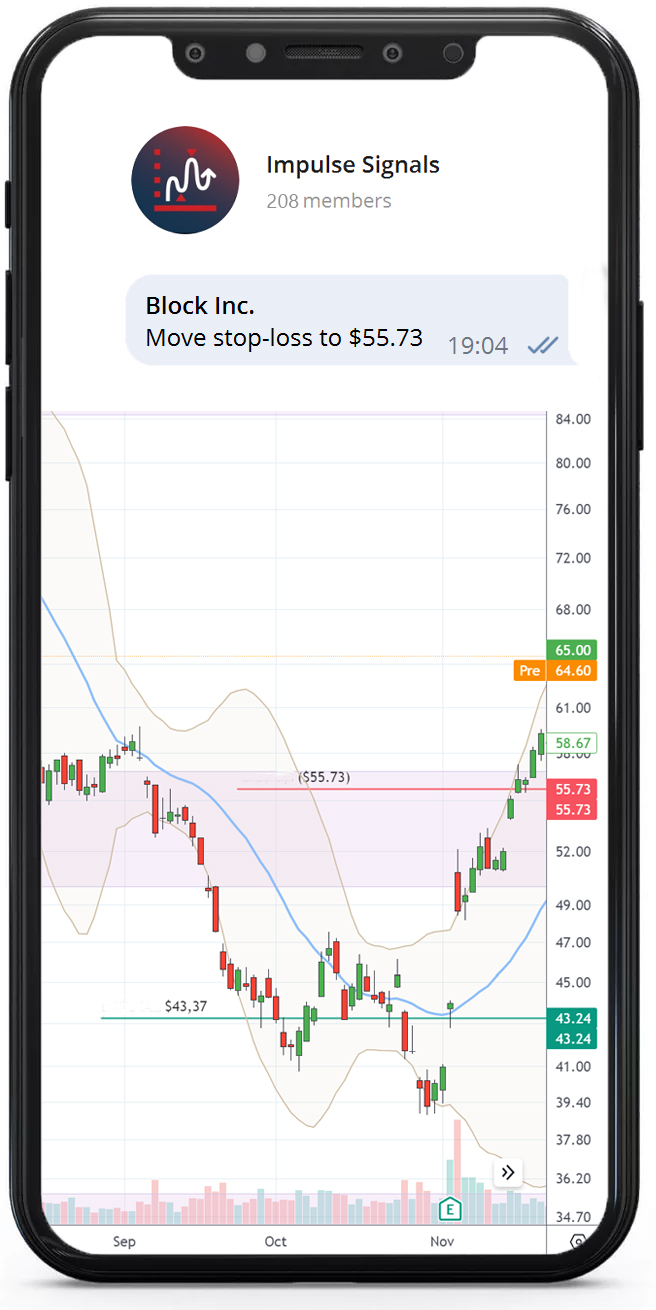
After some time you get the message telling you to move your stop-loss.
In the example price has risen to $58,67, therefore you move your stop-loss 5% below the price which is at $55,73 level.
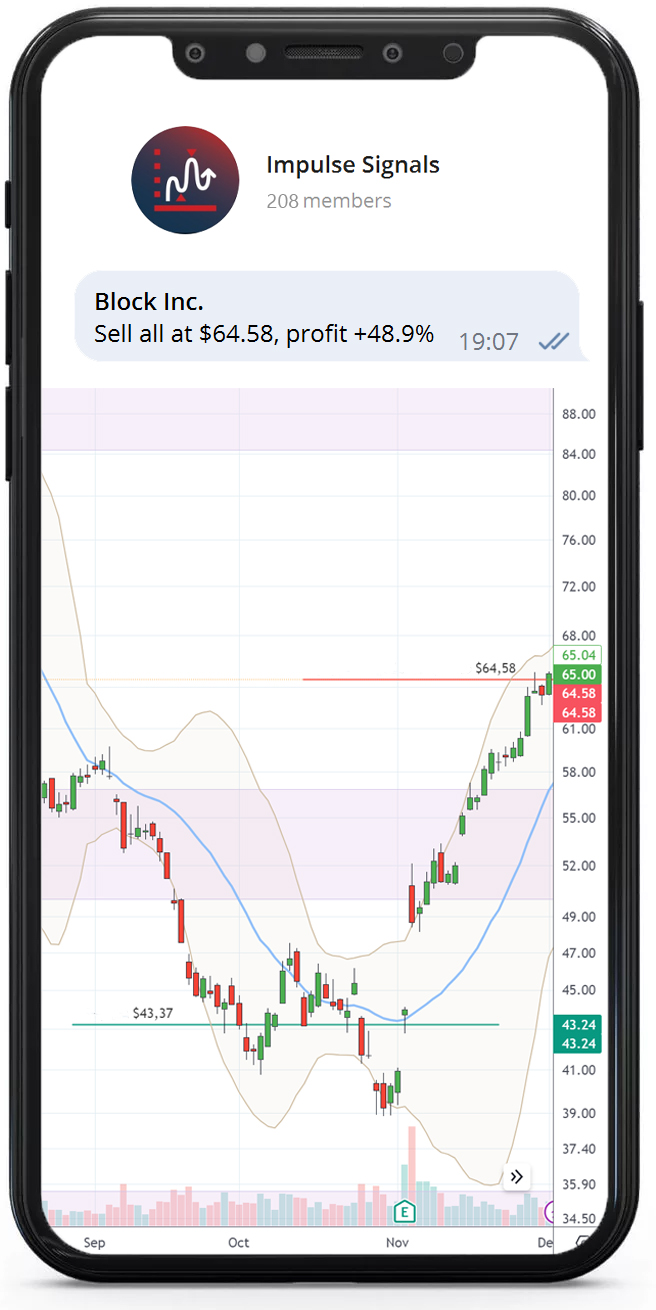
Now you get the message to close position at current price of $64,58. This way, the position generates a profit of approximately 48.9%, and you sell all the shares at that price.
The trade was opened on 2 November and closed on 1 December, so the position was held for about a month.
The results below show real trades executed on real trading accounts using ImpulseAlgo™ signals. The table lists each trade’s entry and exit dates, prices, and realized percentage return.
| Instrument | Entry date | Entry price | Exit date | Exit price | Result | |
|---|---|---|---|---|---|---|
| Citigroup (C) | 21-08-2026 | 132.03 | 11-09-2026 | 139.80 | -5.88% | |
| Adobe Inc. (ADBE) | 29-07-2026 | 250.00 | 06-09-2026 | 275.55 | 10.22% | |
| Saleforce (CRM) | 29-07-2026 | 184.77 | 04-09-2026 | 259.80 | 40.60% | |
| Paypal Inc. (PYPL) | 13-07-2026 | 47.30 | 28-08-2026 | 60.00 | 26.85% | |
| Boeing Inc. (BA) | 15-06-2026 | 228.99 | 26-08-2026 | 221.00 | -3.49% | |
| Teradyne Inc. (TER) | 05-08-2026 | 397.14 | 18-08-2026 | 423.00 | 6.51% | |
| Ultra Beauty, Inc. (ULTA) | 30-07-2026 | 508.39 | 11-08-2026 | 544.00 | 7.00% | |
| Citigroup (C) | 20-07-2026 | 130.28 | 11-08-2026 | 133.00 | -2.09% | |
| Advanced Micro Devices (AMD) | 30-07-2026 | 465.55 | 04-08-2026 | 514.00 | -10.41% | |
| Seagate (STX) | 24-07-2026 | 888.10 | 27-07-2026 | 811.40 | -8.64% | |
| Alcoa Inc. (AA) | 15-06-2026 | 64.16 | 23-07-2026 | 45.92 | 28.43% | |
| Wells Fargo (WFC) | 10-06-2026 | 82.39 | 23-07-2026 | 85.53 | 3.82% | |
| Seagate (STX) | 20-07-2026 | 814.33 | 21-07-2026 | 874.39 | -7.38% | |
| Teradyne Inc. (TER) | 09-07-2026 | 379.65 | 21-07-2026 | 366.77 | 3.39% | |
| Celestica, Inc. (CLS) | 29-06-2026 | 324.48 | 21-07-2026 | 323.20 | 0.40% | |
| Chevron Inc. (CVX) | 27-05-2026 | 181.79 | 07-07-2026 | 173.17 | 4.74% | |
| Exxon Mobile (XOM) | 27-05-2026 | 146.75 | 02-07-2026 | 138.92 | 5.34% | |
| Adobe Inc. (ADBE) | 11-06-2026 | 218.82 | 01-07-2026 | 208.90 | 4.53% | |
| Saleforce (CRM) | 10-06-2026 | 171.12 | 29-06-2026 | 158.00 | 7.66% | |
| Netflix Inc. (NFLX) | 06-05-2026 | 86.79 | 29-06-2026 | 76.02 | 12.40% | |
| Uber Inc. (UBER) | 27-05-2026 | 70.11 | 24-06-2026 | 74.65 | -6.47% | |
| Uber Inc. (UBER) | 07-05-2026 | 79.69 | 26-05-2026 | 69.96 | -12.21% | |
| Bank of America (BAC) | 10-04-2026 | 52.63 | 08-05-2026 | 54.52 | 3.58% | |
| Teradyne Inc. (TER) | 01-05-2026 | 346.74 | 07-05-2026 | 350.21 | 1.00% | |
| Wells Fargo (WFC) | 13-02-2026 | 86.42 | 24-03-2026 | 79.76 | 7.70% | |
| Block Inc. (XYZ) | 06-03-2026 | 65.79 | 18-03-2026 | 76.78 | 16.7% | |
| Citigroup (C) | 24-02-2026 | 108.70 | 10-03-2026 | 108.29 | 0.37% |
REALIZED PERFORMANCE
Cumulative realized profit and loss from every closed trade in the table, ordered by exit date and calculated with a fixed $50,000 cost basis for each entry.
Latest realized P/L
Profitable close
Losing close
$50,000 × table result %; values accumulate on each exit date.
PERFORMANCE-ALIGNED PRICING
There is no recurring subscription and no management fee charged simply for holding your capital. Our compensation is tied directly to realized results.
SUCCESS FEE
of realized profit only
No profit → no success fee
Many traditional managers and managed-account services charge an ongoing percentage of assets under management, even when performance is flat or negative. With our model, the fee becomes payable only after profit has been realized.
01
You are not charged simply because capital is allocated or remains in your own account.
02
A losing or break-even trade produces no success fee, keeping our incentives aligned with yours.
03
On a $50,000 entry with a 10% realized gain, profit is $5,000: the fee is $1,000 and you retain $4,000.
The exact service terms and calculation method are confirmed with the client before trading begins.