LIQUIDITY MAPS AND HOW TO USE THEM IN CRYPTO
PUBLISHED: 2025-02-09
CATEGORY: Knowledge Base
In the fast-paced world of cryptocurrency trading, understanding market dynamics can be the key to making informed decisions. Among the array of tools available to traders, liquidity maps have emerged as a sophisticated visual aid that can demystify complex market behaviors. A liquidity map provides a snapshot of where the market might find significant buying or selling pressure, often highlighting zones where large numbers of leveraged positions could be liquidated. This tool is particularly useful in the crypto market, where volatility is high and price movements can be swift and unpredictable.
What is liquidation
Liquidation is a critical concept in the world of cryptocurrency trading, especially when dealing with leveraged positions. Liquidation involves converting assets into cash to cover obligations or losses. In the context of crypto trading, liquidation occurs when a trader's collateral is automatically sold by the exchange to cover a losing leveraged position. This mechanism ensures that both the trader and the trading platform manage risk effectively.
In a leveraged long position, such as using a perpetual swap on an exchange, the trader expects the asset's value to rise. However, if the asset’s price falls, the trade incurs losses. Leverage magnifies these losses, increasing the risk of completely losing the invested funds as the asset’s price continues to decline. The same principle applies in reverse for short positions.
To manage this risk, the exchange or broker sets a specific price level known as the liquidation price, which automatically closes the trade when reached. This liquidation price is usually displayed to the trader when they open their position, allowing them to effectively manage their investment. Generally, the liquidation price is directly related to the amount of leverage used. For example, if a trader takes a long position on BTC with 5x leverage, the liquidation price will be much lower, requiring a larger percentage drop in the asset’s price to trigger liquidation, compared to using 20x leverage.
how liquidation really happens
Leverage trading is actually taking a loan from exchange to purchase a desired asset while having a little amount on your hands. For example, you have $1000 and you want to open position that is worth $2000. In this case you borrow $1k from exchange which is 2x leverage and buy let’s say 1 ETH.
So, exchange has to ensure that their landing amount will be safe that is why it sets required margin level. In our example if the price of 1 ETH falls to around $1k (in reality margin level is higher to account for the slippage) than the exchange will force sell your assets to get back its initial lending amount. That is called liquidation.
It is worth noting that usually when price of ETH comes close to the liquidation price, let’s say ETH’s price dropped to $1.1k, an exchange sends you a margin call which means that either you need to add cash to account or if price falls to liquidation level (let’s say $1050) your position will be force closed.
practical example
You can keep track of the percentage the market needs to move against your position it to be liquidated by using this formula:
Liquidation % = 100 / Leverage
For instance, if you use 5x leverage, your position will be liquidated if the price of an asset moves 20% against your position (100/5 = 20.)
Let us give another example in practical terms.
A trader opens leverage long position on BTC with leverage of 10X. This means that having invested $10k trader opens position of $100k. In other words, to buy 1 BTC with trader’s 10K exchange provides another 90K to the trader (we may say lends). Now the question is how many % market should move against trader’s position for it to be liquidated. Or let us put it other way: exchange will have to sell trader’s position as soon as the price of BTC comes close to 90k to save lent money.
According to the provided formula – 10%, that is if the price of Bitcoin falls below $90k the trader would be liquidated, or in other words his bitcoin position would be sold and money that exchange gets from this position will go to fulfill provided money to the trader.
How to read liquidation Map
A liquidation map provides a visual chart of liquidations or liquidation risk in the futures cryptocurrency trading market. It displays liquidations that are predicted based on previous price trends.
When traders engage in trading on unregulated cryptocurrency derivative exchanges, they are constantly exposed to additional risks, namely liquidation risks. When the liquidation price of a trader's position is triggered, their position is forcibly closed by the exchange's risk engine.
The impact on the market is relatively small when a small number of positions are liquidated. However, if thousands of positions with similar liquidation prices are liquidated, the effect on the market price can be significant. Moreover, market buy and sell orders triggered by liquidations can cause rapid price movements, leading to a "cascading effect" where more nearby positions get liquidated. This phenomenon creates substantial price fluctuations (which institutional players often take advantage of as an entry strategy since the rapid injection of liquidity within a short period can meet the demand for institutional large orders).
So now let us look at the liquidation map below. The X-axis represent the price at which liquidations will take place, that is exchanges will close positions forcibly. On the Y-axis we see how much in dollars will be liquidated.
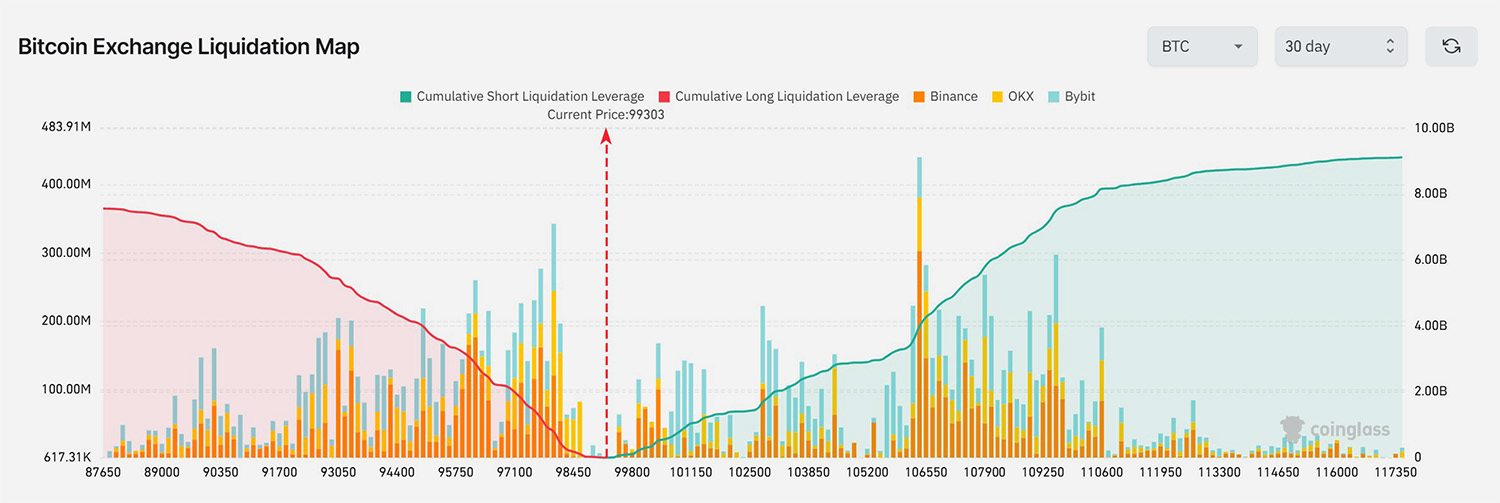
The right Y axis is for aggregate liquidations, that are shown by the red or green lines. So for example at the image below you can see that if price goes from the current state all the way to the $117k the total liquidation level will reach about $9B, the same holds true for the long positions that will be liquidated at the amount of about $7.5B, which is denoted by red line.
The same goes for longs liquidation that is represented with red area. As we can see on the map within 30 days traders opened more cumulative short positions, represented by about $9B of total liquidations if price goes up. And this is compared to about 7.6B of long positions liquidations at the same time period. Basically, this means that leveraged traders are more bearish than bullish and bet on price going down in short-term.
So, the red and greed areas represent cumulative liquidation levels from the current price to the right and left. If the area under the green line is larger than under the red line, it means that there are more shorts on the market.
The right Y axis shows the volume of liquidation at particular price, that is denoted by vertical chart bars. So, on the chart below you can see that the biggest liquidation will happen if BTC goes to around $106 500. At that price about $450M worth of short positions will be liquidated on three major exchanges.
As you can see on the map there are several clusters of liquidation. If we look at shorts liquidation the first prominent cluster is somewhere between 106k and 107k (blue rectangles). On the long side the evident cluster is between 97k and 98k.
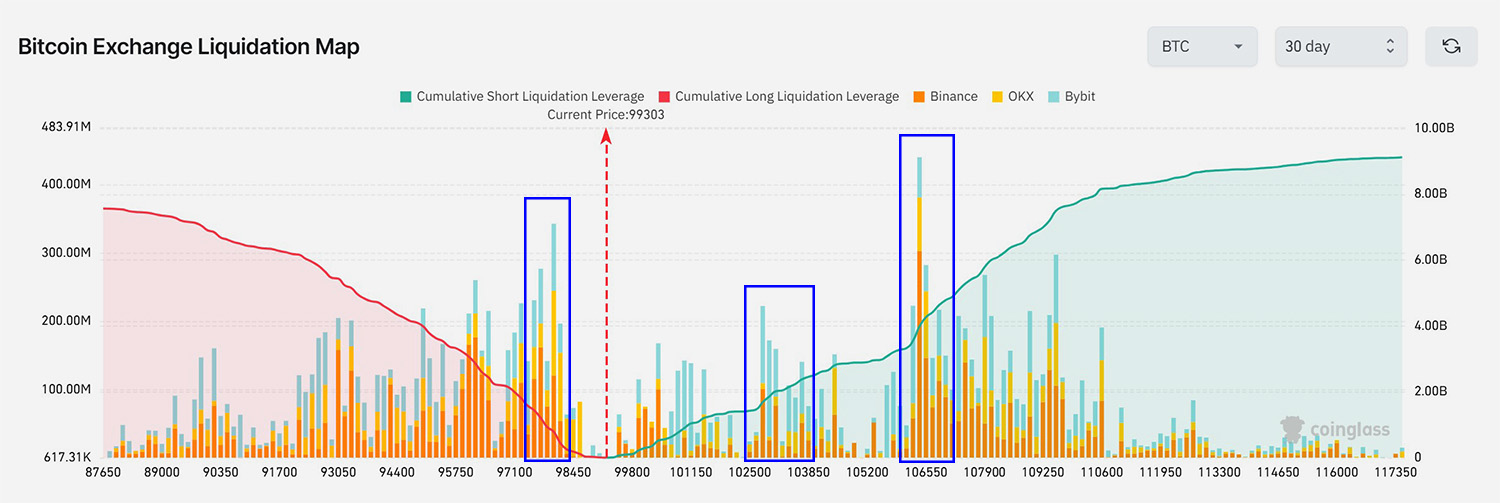
So the most important rule that you need to understand is that exchanges seek liquidity, in other words they will try to lead the price to the most liquidity concentrated areas in price. The more liquidation volume is concentrated at some price, the more likely exchanges will make the price flush out this liquidity zone.
how can it be used
The liquidation heat map allows traders to identify areas of high liquidity, which can be helpful in various ways:
Magnet Zone: Concentration of potential liquidation levels within a specific price range may indicate that the price is likely to move towards that zone. Some traders utilize these liquidation levels to gauge the possible direction of price movement and as additional indicators for convergence.
Support/Resistance Zone: In high liquidation areas, larger traders or "whales" can execute trades rapidly at favorable prices. Once they enter or exit orders within this liquidity, the price can now reverse.
Furthermore, liquidation levels can exert significant pressure on either the buy or sell side of the order book, leading to a natural price reversal.
Why exchanges seek liquidity?
Preventing Cascading Failures: By liquidating positions that are at risk of default, exchanges prevent a scenario where one trader's failure could lead to a domino effect, destabilizing the market further. This is particularly crucial in volatile markets where large, unmanaged losses could lead to systemic issues.
Reallocation of Assets: Liquidating positions allows the exchange to reallocate assets more efficiently. Capital tied up in losing positions can be freed up, enhancing liquidity for other trades.
Adherence to Financial Regulations: Exchanges are often required by financial regulators to ensure that they have mechanisms in place to manage client risk. Liquidations are a part of this framework to maintain market integrity and protect investor interests.
Liquidation Fees: While not the primary reason, exchanges might earn revenue from liquidation fees. These fees can help cover costs associated with the liquidation process, although this is generally a smaller aspect compared to risk management.
Price Impact: In some cases, liquidations can help correct market anomalies where prices might be driven far from their fundamental values due to leverage. By forcing sales at or near market prices, liquidations can help in returning the market to a more balanced state.
In summary, while liquidations can sometimes lead to significant losses for individual traders, they are crucial for maintaining the health, stability, and integrity of the trading ecosystem. They serve as a mechanism to manage financial risks systematically across the market.
Liquidation heatmap
Heatmap basically represents the same concept as the liquidation map, but in a different view. Heatmap predicts the price levels at which large-scale liquidation events may occur. The liquidation heatmap calculates the liquidation levels based on market data and different leverage amounts. The calculated levels are then added to the prices on the chart.
As more estimated liquidation levels are added to a particular price, the colors on the heatmap change. The color range goes from purple to yellow, with yellow representing a high number of predicted liquidation levels, allowing traders to identify areas of high liquidity.
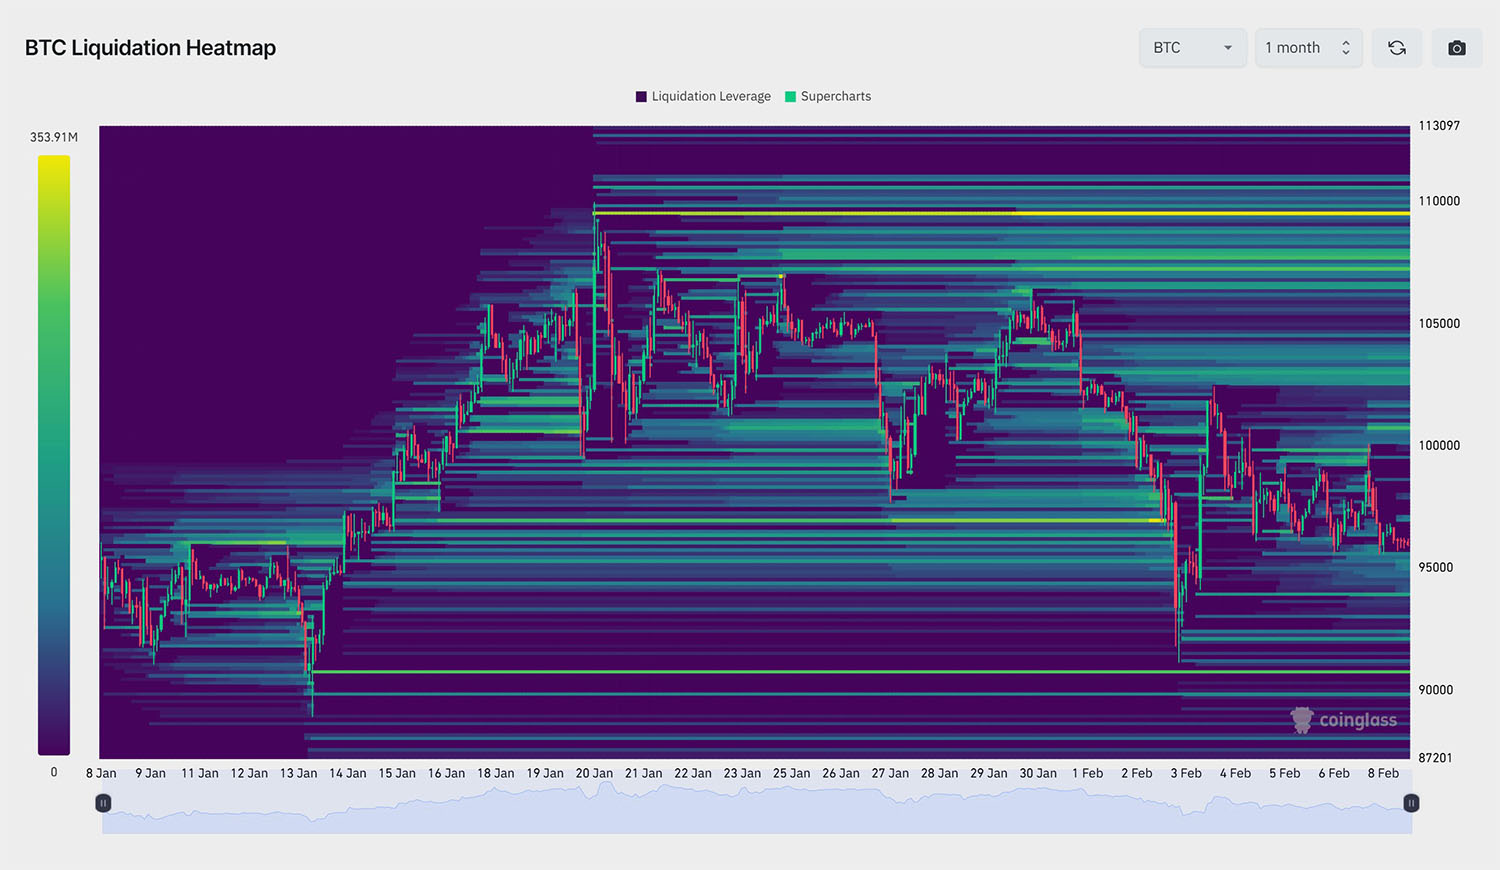
The liquidation heatmap predicts where liquidation levels are likely to initiate but not where they will stop. Therefore, the actual number of liquidations will be fewer. When considering the size, it must be viewed as a relative figure by comparing it with other levels. Traders can filter multiple major exchanges, trading pairs, and historical liquidation data.
The liquidation heat map allows traders to identify areas of high liquidity, which can be helpful in various ways:
Magnet Zone: Concentration of potential liquidation levels within a specific price range may indicate that the price is likely to move towards that zone. Some traders utilize these liquidation levels to gauge the possible direction of price movement and as additional indicators for convergence.
Support/Resistance Zone: In high liquidation areas, larger traders or "whales" can execute trades rapidly at favorable prices. Once they enter or exit orders within this liquidity, the price can now reverse. So for example if a trader wants to buy an asset it is best to place a buy order under the liquidation area as if liquidation happens, price usually pierces the level lower to fulfill the aggregate orders and will likely you order will be filled as well.
On the chart as you can see if trader wanted to create position in BTC it would be wise to put a buy order at the level of $90 500 or maybe even lower as the liquidation level of $90 705 will trigger sells from exchanges that will make price fall further. Usually after this liquidation event the reversal takes place.
At the other side if you have a short-term position in BTC it would be wise to wait for an asset to go up to the level of $109 600 where the most liquidity for shorts is concentrated. This is your likely target for upside.
Furthermore, liquidation levels can exert significant pressure on either the buy or sell side of the order book, leading to a natural price reversal.
Conclusion
In conclusion, a liquidation map in the context of cryptocurrency trading is an invaluable tool for both seasoned and novice traders. It provides a visual representation of where leveraged positions in the market are most likely to be liquidated, highlighting potential support and resistance levels based on the concentration of long and short positions.
By understanding these zones, traders can better anticipate market movements, manage their risk, and potentially capitalize on the volatility caused by mass liquidations. However, while liquidation maps offer insightful data, they should be used in conjunction with other analytical tools to form a comprehensive trading strategy, acknowledging that market dynamics can be unpredictable and influenced by numerous external factors. Remember, the effectiveness of using a liquidation map also depends on real-time updates and the trader's ability to adapt to rapidly changing market conditions.
Disclaimer: This statement does not constitute financial advice. The information provided is for informational purposes only and should not be considered as investment advice. If you require financial advice, please consult with our certified financial consultants who can offer personalized guidance based on your specific financial situation.
#liquidity #map #crypto #liquidation