GLASSNODE CRYPTO MARKET UPDATE

PUBLISHED: 2026-10-23
CATEGORY: Market Analysis
Bitcoin’s next move depends on the quality of demand, not simply on another bounce. We explain the market signals highlighted in Glassnode’s October 21 report and turn the difficult terminology into a clear reading guide.
Learn how to distinguish buying interest from a short-lived squeeze, read ETF flows alongside trading volume, and follow three conditional scenarios without treating any price level as a guarantee.
01 / Executive view
A bounce needs confirmation
Bitcoin’s test near $80.1K leaves two questions: can the $80K–81.5K cost-basis area hold, and can demand absorb supply around $85K–87.5K? A rebound becomes more useful evidence when the market keeps the ground it has recovered.
Our reading framework separates three things: the price area being tested, the quality of demand around it, and the leverage that could exaggerate the next move. Agreement between these signals matters more than a dramatic candle.
For readers, the practical task is to follow what happens after the initial move. Does price keep the ground it has gained? Does buying continue on subsequent sessions? Can the market absorb selling without repeatedly falling back?
The scenarios below are a checklist for assessing that evidence. They are conditional interpretations, not probability estimates or automatic instructions to buy and sell.
02 / Support and cost basis
What a support level can tell us
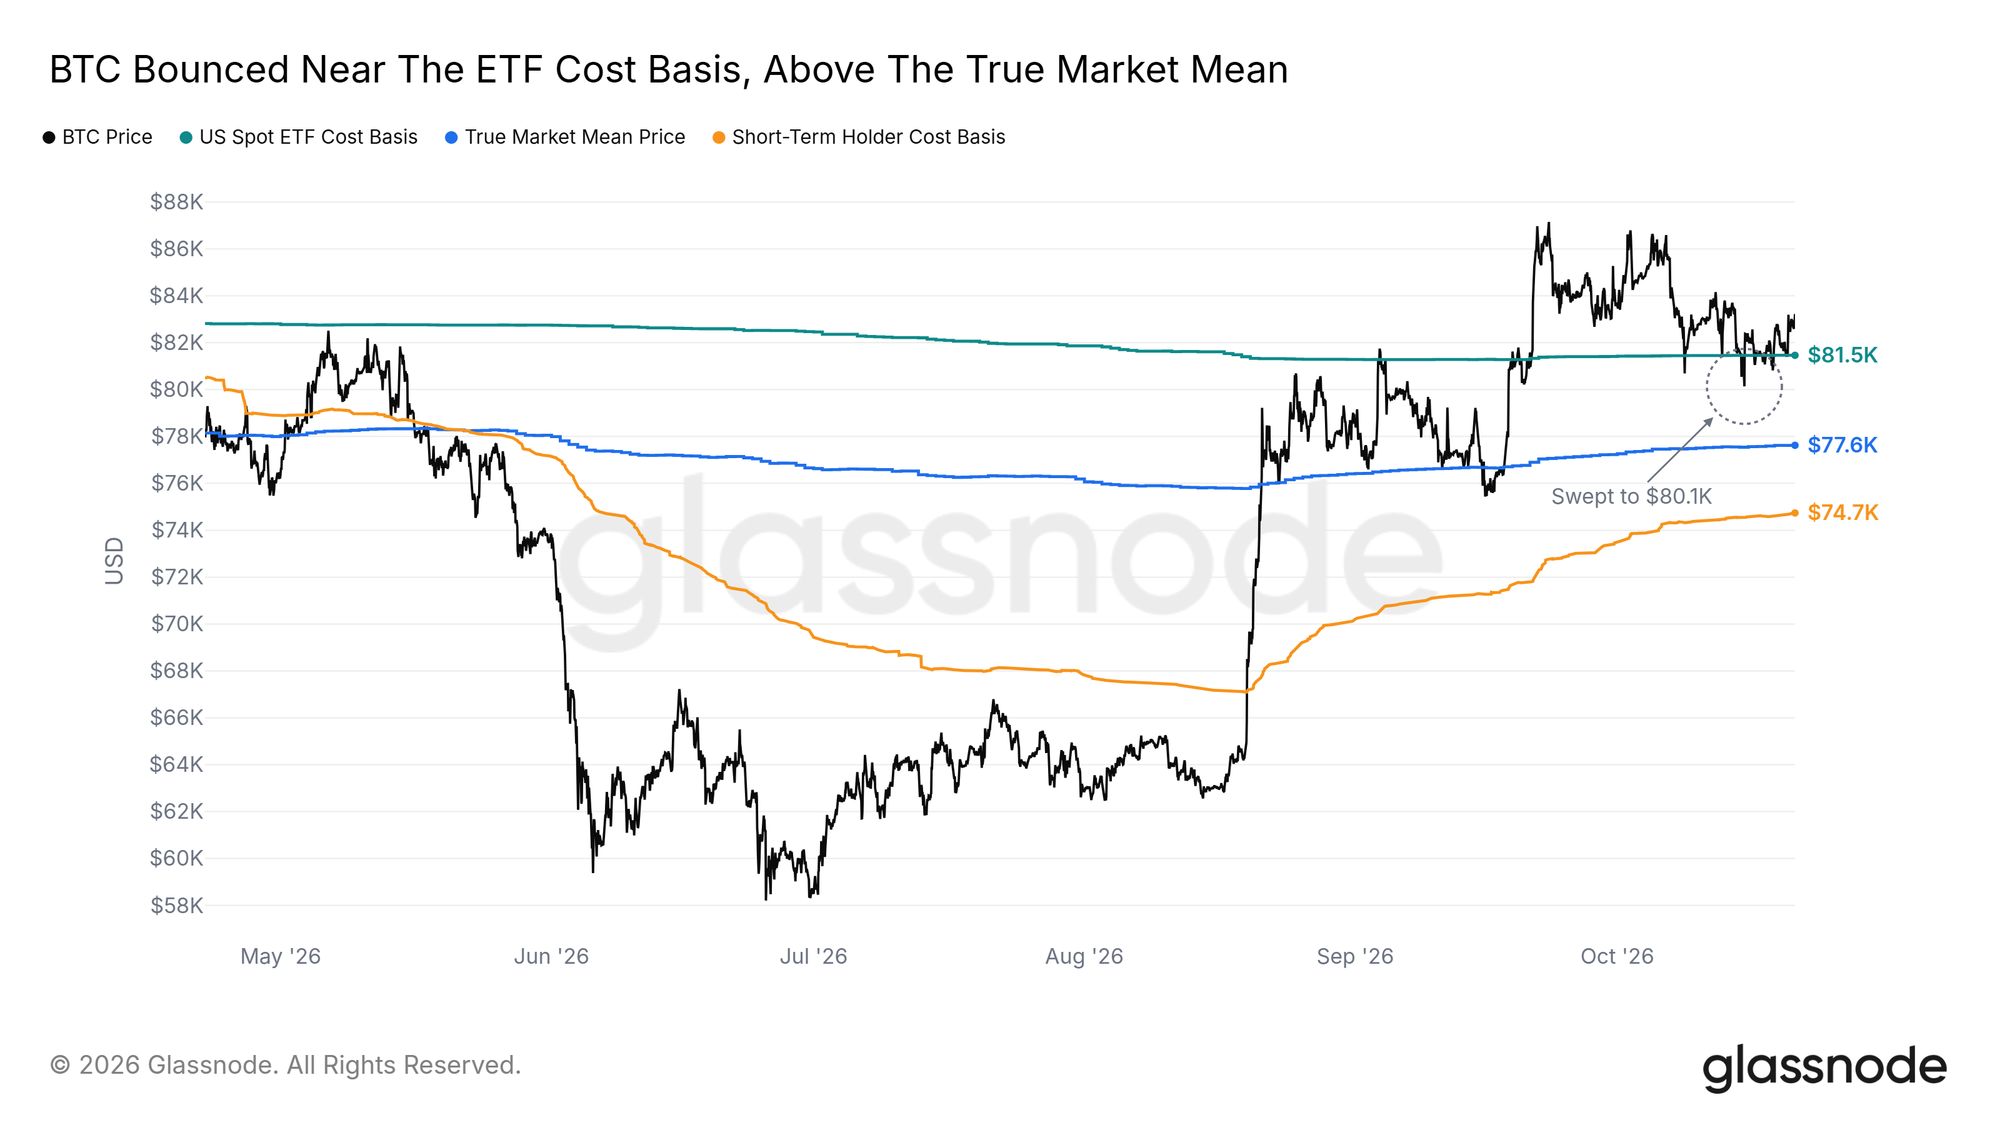
A stronger test is behavioural: after a dip, does price recover and remain above the area, or does each attempted recovery meet fresh selling? Repeated failure to regain a lost level is a different signal from a brief excursion below it.
This analysis uses Glassnode’s October 21, 2026 report as a dated snapshot, rather than a live price update. Its True Market Mean is near $77.6K. The charts below retain the original data and the distinctions between the indicators.
Cost basis means an estimated average acquisition price for a defined group of holders. It helps describe their financial position; it does not reveal the price at which every member will buy or sell. Different accounting and on-chain methods can produce different estimates.
Think of a busy road junction. Many travellers pass through it, so it deserves attention. That does not mean a barrier will always stop traffic there. Likewise, a widely watched market level can attract both purchases and selling.
03 / Liquidity and execution
Orders and liquidations are different
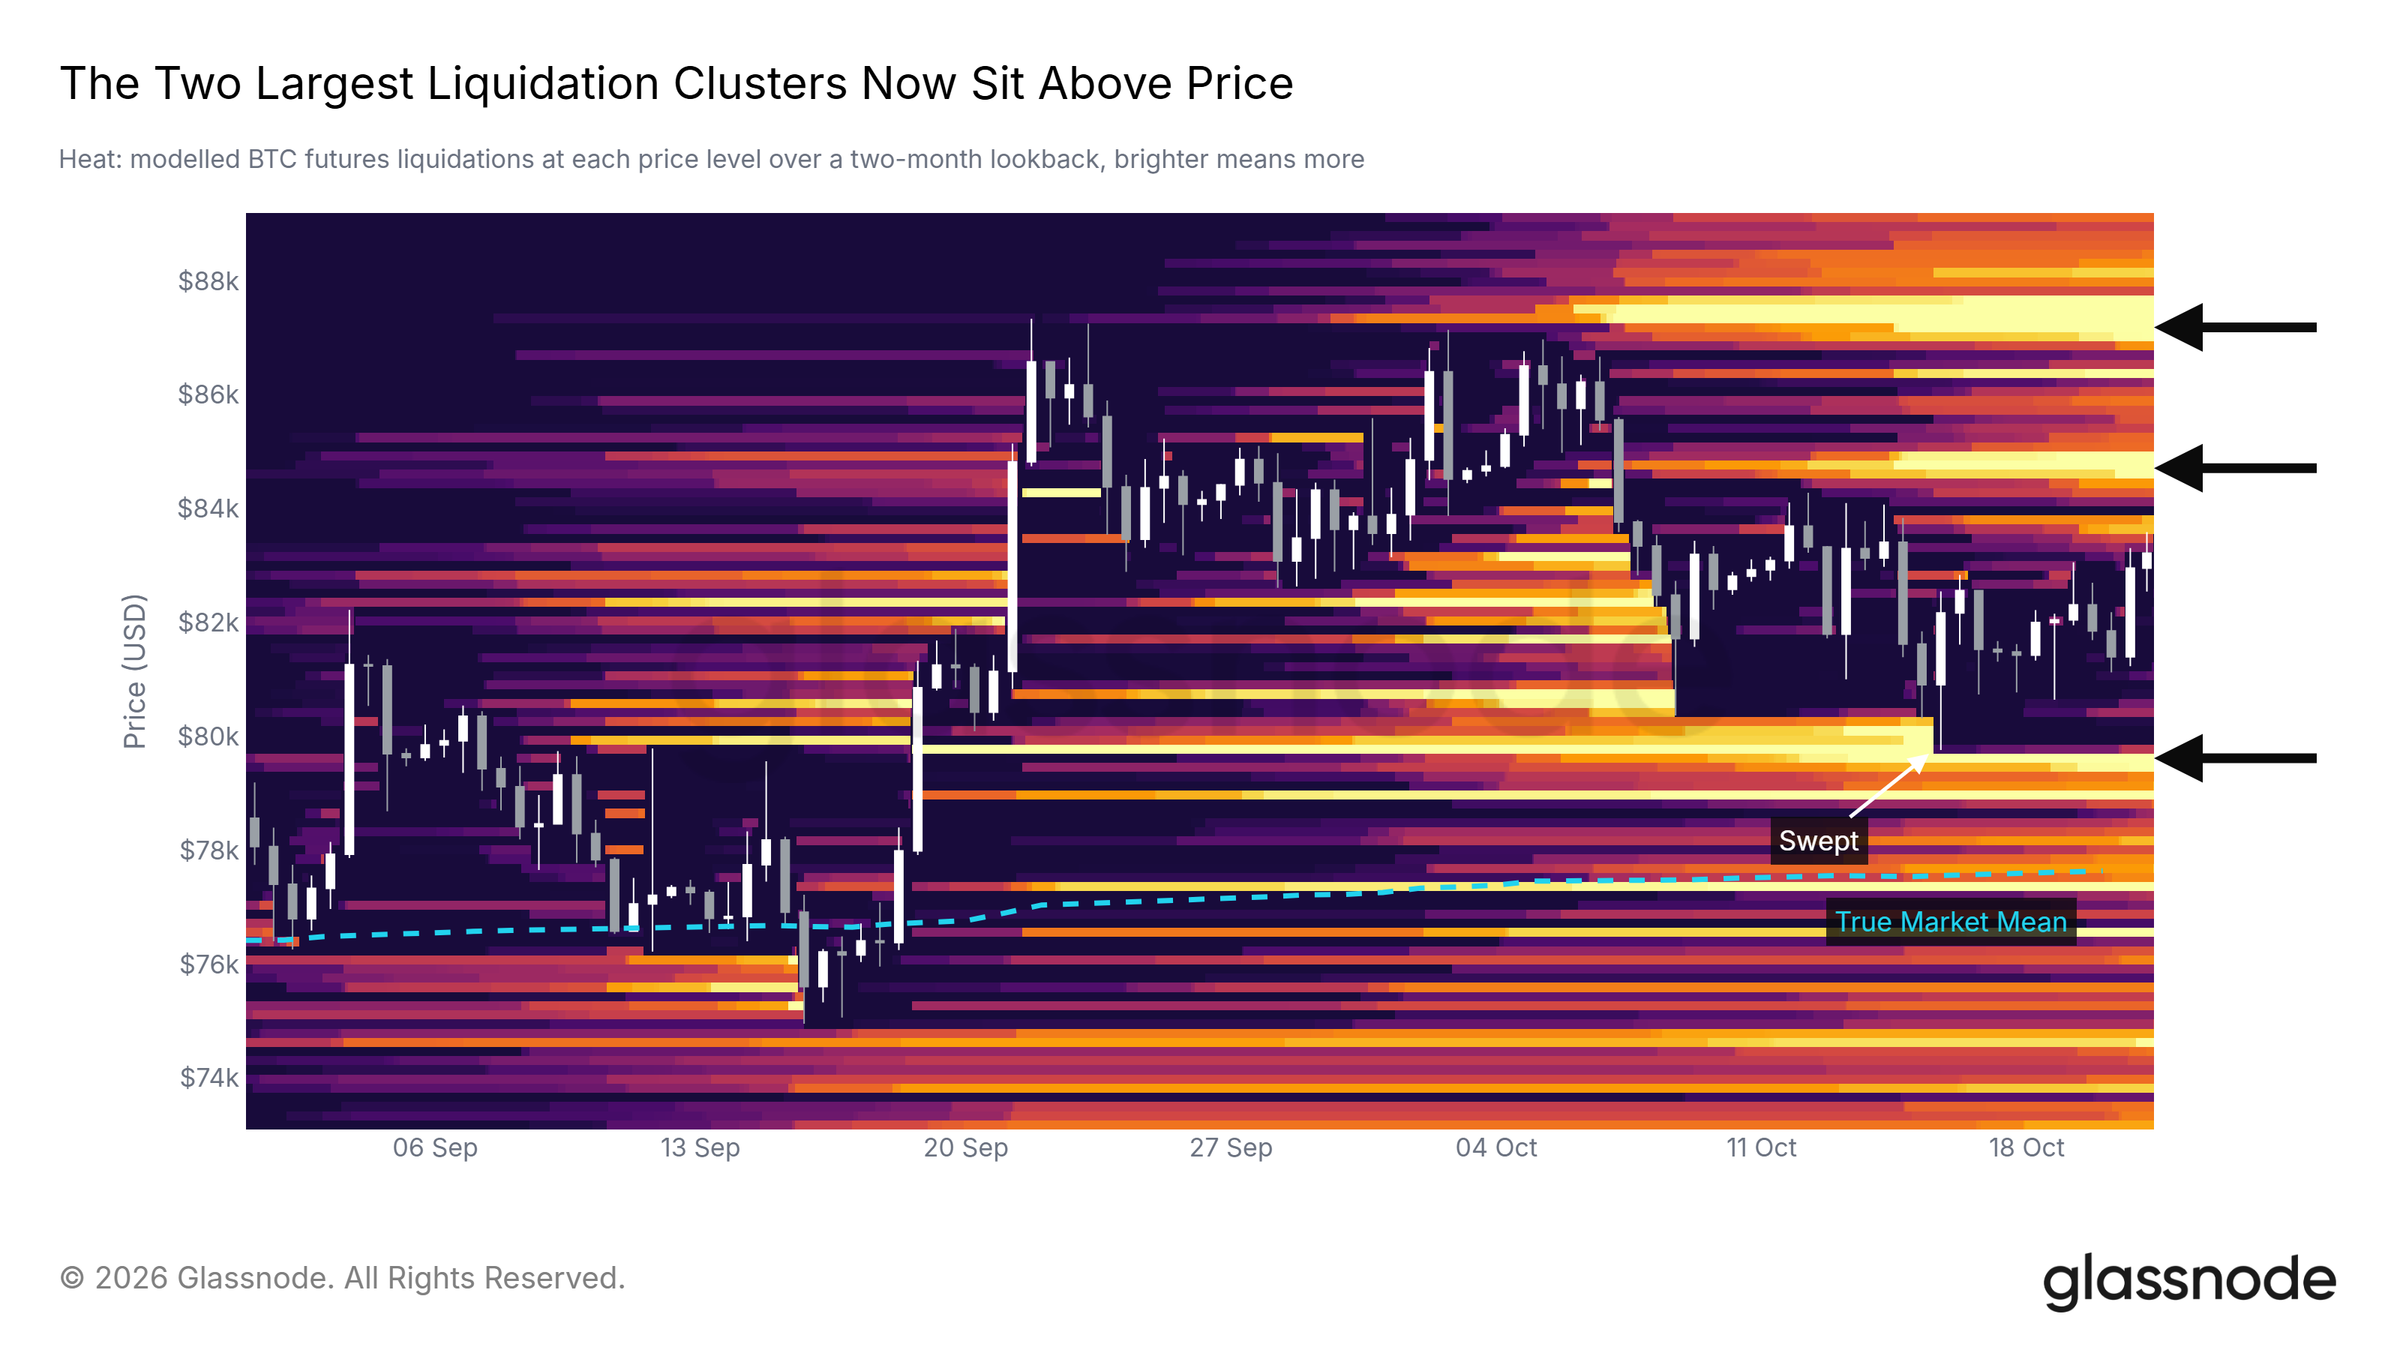
Our interpretation: watch whether price holds after the burst of forced trading. A sustained move with orderly pullbacks gives different evidence from a spike that immediately returns to its starting point. Bright bands alone do not tell us which outcome will occur.
An order book shows bids to buy and offers to sell. These orders can be changed or cancelled before a trade occurs. A large displayed order therefore represents potential liquidity, not a promise that someone will defend a price indefinitely.
A liquidation map asks a different question: where could leveraged positions face forced closure? Its coloured bands are model estimates. Exchanges, collateral rules and traders’ later actions can change the eventual outcome.
When short sellers are forced to close, their purchases can accelerate a rally. That mechanical buying may fade once the positions have closed. A fast upward move can therefore coexist with weak longer-lasting demand.
04 / Institutional demand
Read ETF flows and volume together
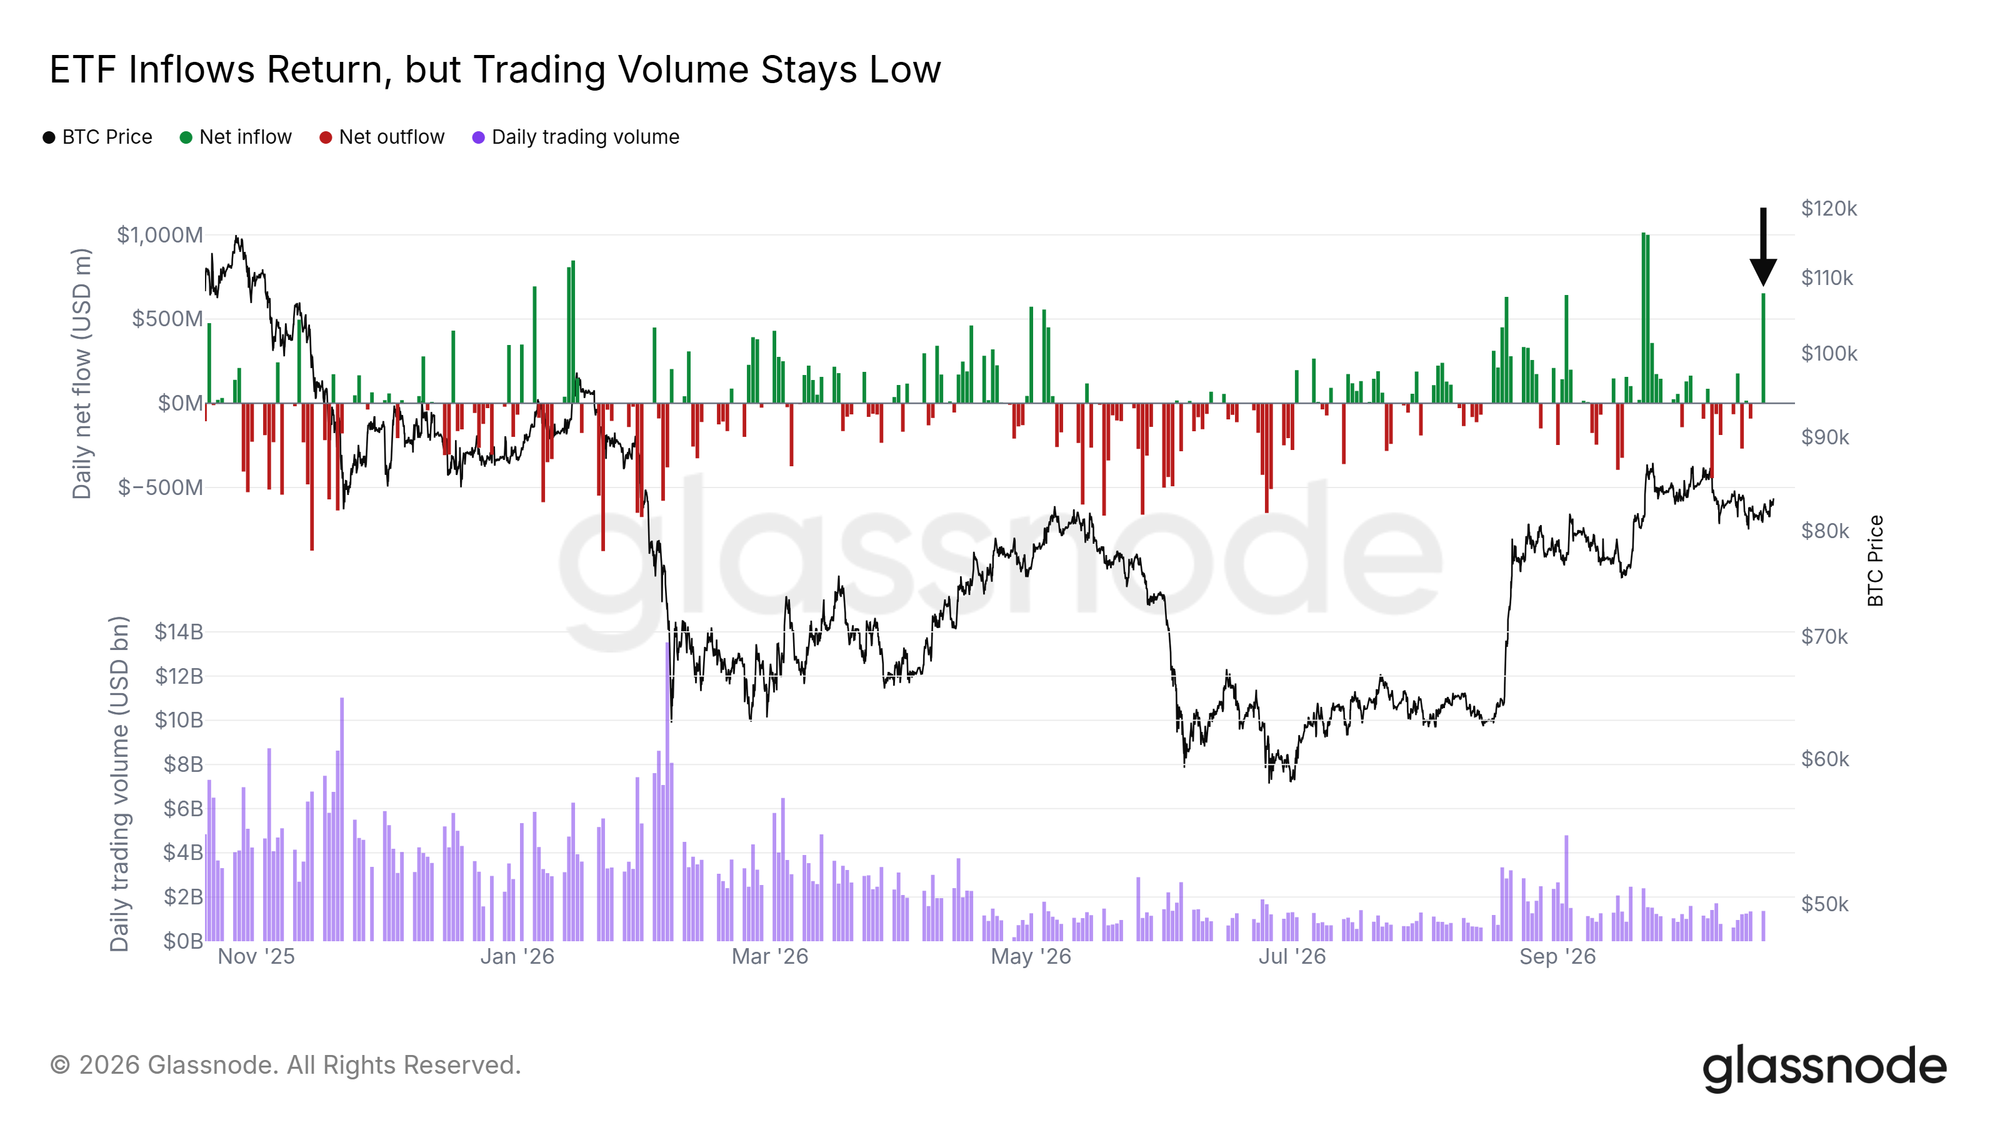
For our assessment, a sequence is more informative than an isolated day. Compare several sessions of flows with price behaviour and trading conditions. If inflows continue but price repeatedly loses ground, ask how much selling those purchases are having to absorb.
The report records about $653M of ETF inflows on October 19 alongside subdued trading volume. Treat this as one observation, rather than proof of a durable change in market direction.
An ETF share can trade from one investor to another without creating a new share. Fund creations and redemptions operate through a separate primary-market process. Consequently, trading turnover and net fund flows measure different activity; neither should be used as a substitute for the other.
A simple example: a busy day of shares changing hands could leave fund assets broadly unchanged. A quieter session could still include net creations. The first describes turnover; the second describes a change in the fund’s outstanding exposure.
05 / Leverage
Calmer funding does not mean zero risk
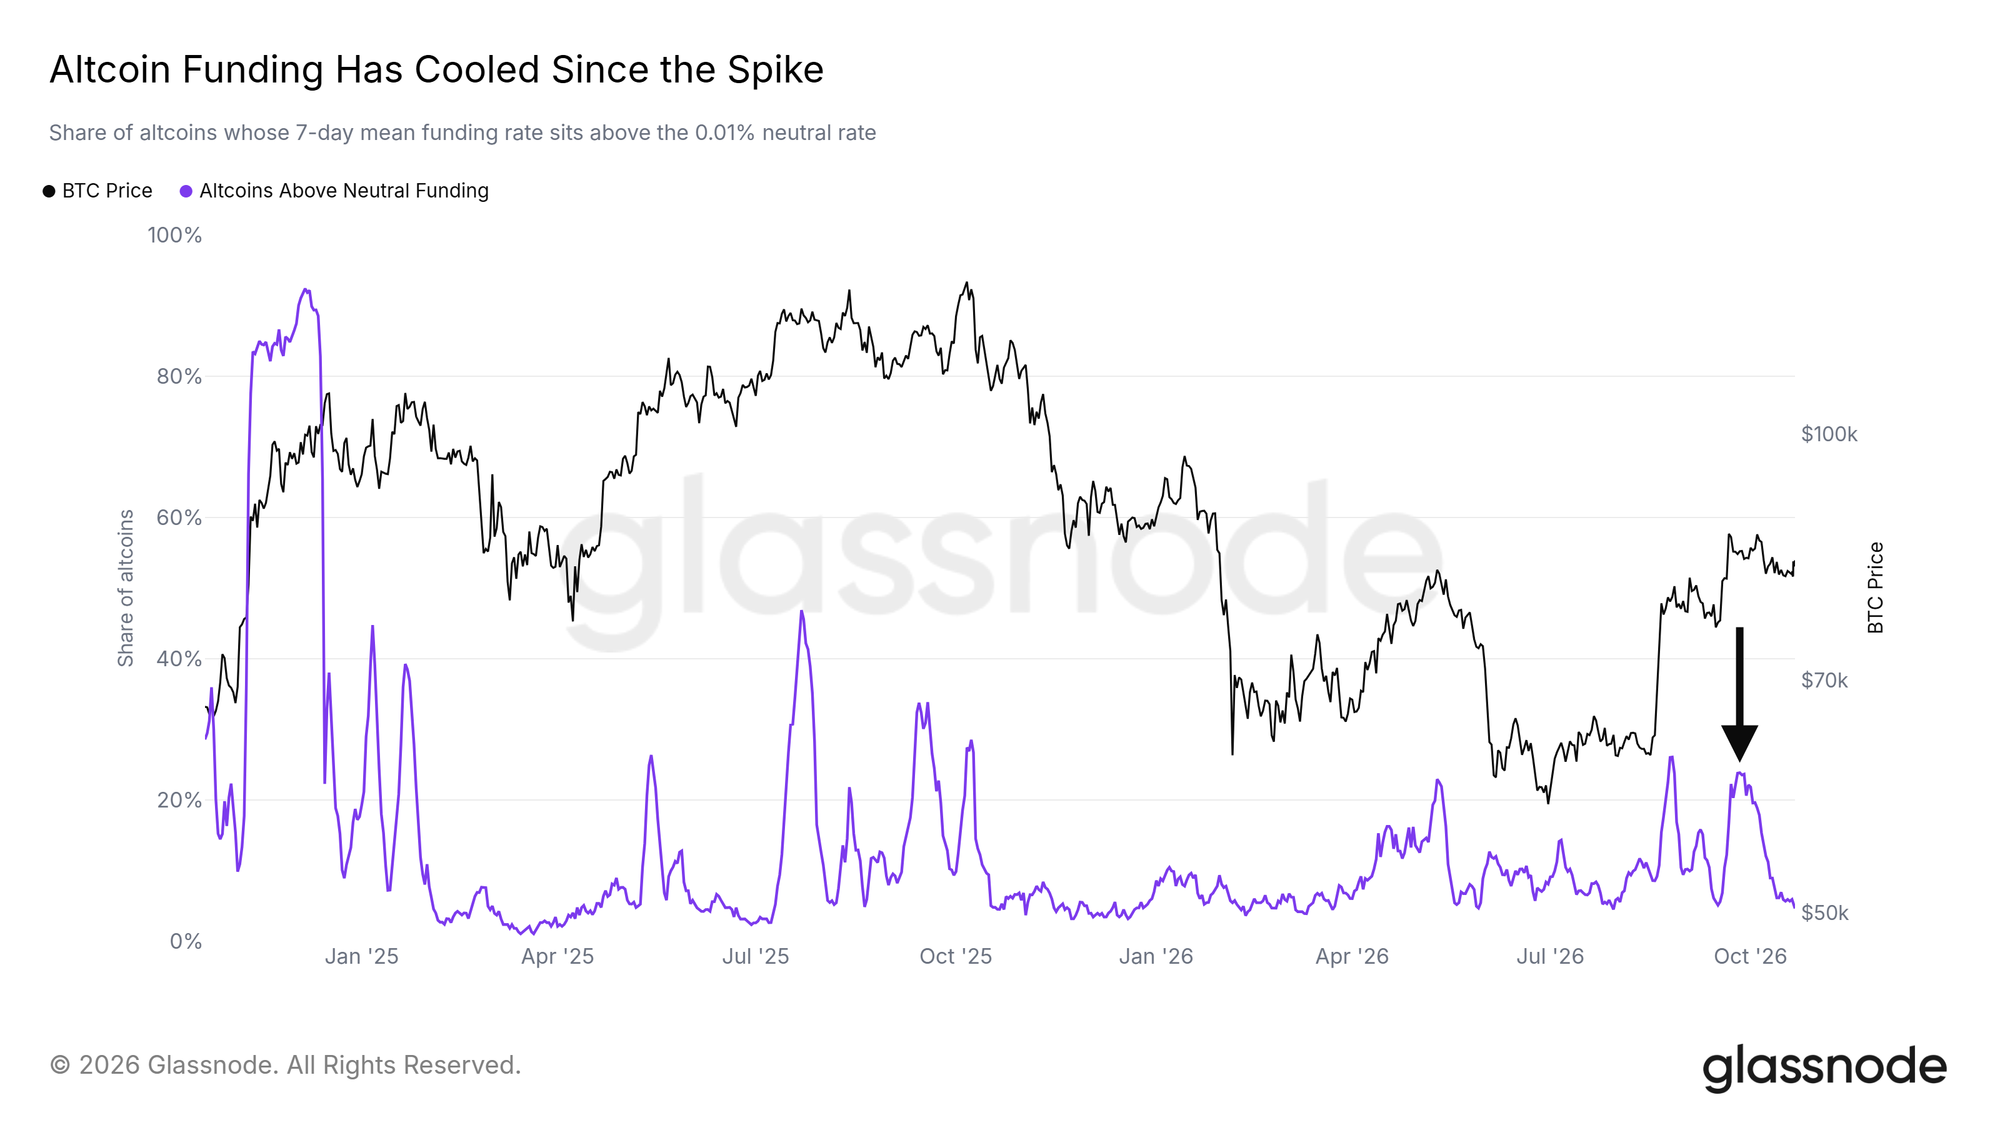
A hypothetical example makes the risk clearer: funding can become cheaper while a trader keeps the same leveraged position. The recurring payment has fallen, but the exposure has not disappeared. A later price shock can still force a hurried exit.
Glassnode also describes cooler altcoin funding with relatively little reduction in open positions. That combination deserves a distinction between the price of maintaining a position and the amount of exposure still in place.
Funding is a periodic payment between holders of long and short perpetual contracts. A positive rate normally means longs pay shorts; a negative rate reverses the direction. The mechanism encourages the contract price to stay near its underlying reference price.
Open interest counts contracts that remain outstanding. It differs from volume, which counts contracts traded over a period. Every open contract has a long and a short side, so rising open interest by itself does not establish a bullish direction.
06 / Practical conclusions
Three scenarios to keep the picture clear
1. Demand proves persistent
Price clears a watched supply area, stays above it and attracts buying on a subsequent pullback. Several sessions of supportive flows would add confidence. Our conclusion would become more constructive because the market had demonstrated acceptance, rather than simply touched a higher price.
2. The market remains in a range
Rallies fade and declines recover, without sustained progress in either direction. In this scenario, repeated dramatic headlines may describe little net change. Avoid upgrading every intraday move into a new long-term story; keep the same observation window when comparing signals.
3. Support fails and recovery stalls
Price loses a watched demand area and cannot regain it on a later attempt. Persistent selling would weaken the recovery case. Reassess the original thesis instead of assuming the market must return to a previous level.
What readers can do
Write down the evidence that would change your view before the next sharp move. Separate observations from interpretations, use comparable time periods, and remember that waiting for clearer information is a valid decision. The most useful conclusion is a repeatable process: assess price, demand and leverage together.
#Bitcoin #on-chain analysis #ETF #liquidity #risk management




No comments yet
Be the first to share your perspective.