GLASSNODE DIGITAL ASSET REPORT Q4/2026

PUBLISHED: 2026-10-24
CATEGORY: Market Analysis
Digital-asset prices have endured a difficult year, while the infrastructure around them has continued to develop. This review draws on the Glassnode x Fasanara Digital Q4 2026 report to explain the changes in Bitcoin demand, liquidity, derivatives and institutional participation.
Original report charts show where the recovery is gaining support and where market depth remains fragile. The review also examines stablecoins, tokenized equities and traditional-asset perpetuals, ending with a clear framework for assessing what happens next.
01 / Executive view
Executive summary
The report describes a market recovering from a prolonged drawdown, rather than a return to broad speculative enthusiasm. Bitcoin remains the main destination for capital, while smaller assets have suffered more and trading activity remains below earlier peaks. The August rally began with a short squeeze, but subsequent evidence points to more than forced buying. Realized-cap measures improved, newer coins gained a larger share of on-chain wealth, ETF demand returned and aggressive spot selling eased. These signals support a recovery case without proving that it will persist. Liquidity and leverage require a more careful reading than headline dollar totals suggest.
Lower prices reduce the dollar value of outstanding positions, top-of-book depth varies with tick size, and strong trading volume can coexist with little resting liquidity. Meanwhile, options and on-chain perpetual venues have become more important. The strongest structural developments extend beyond Bitcoin’s price. Stablecoin settlement, tokenized equities and perpetual contracts linked to traditional assets expanded during the downturn. The practical question is whether improving demand and reliable liquidity can turn those developments into a durable market recovery.
02 / Macro backdrop
Treasury support and the cost of money
The report places rising US borrowing costs and larger Treasury buybacks at the centre of the macro backdrop.
Based on Glassnode x Fasanara Digital’s Q4 2026 Institutional Perspective. Charts and observations retain the report’s original dates.
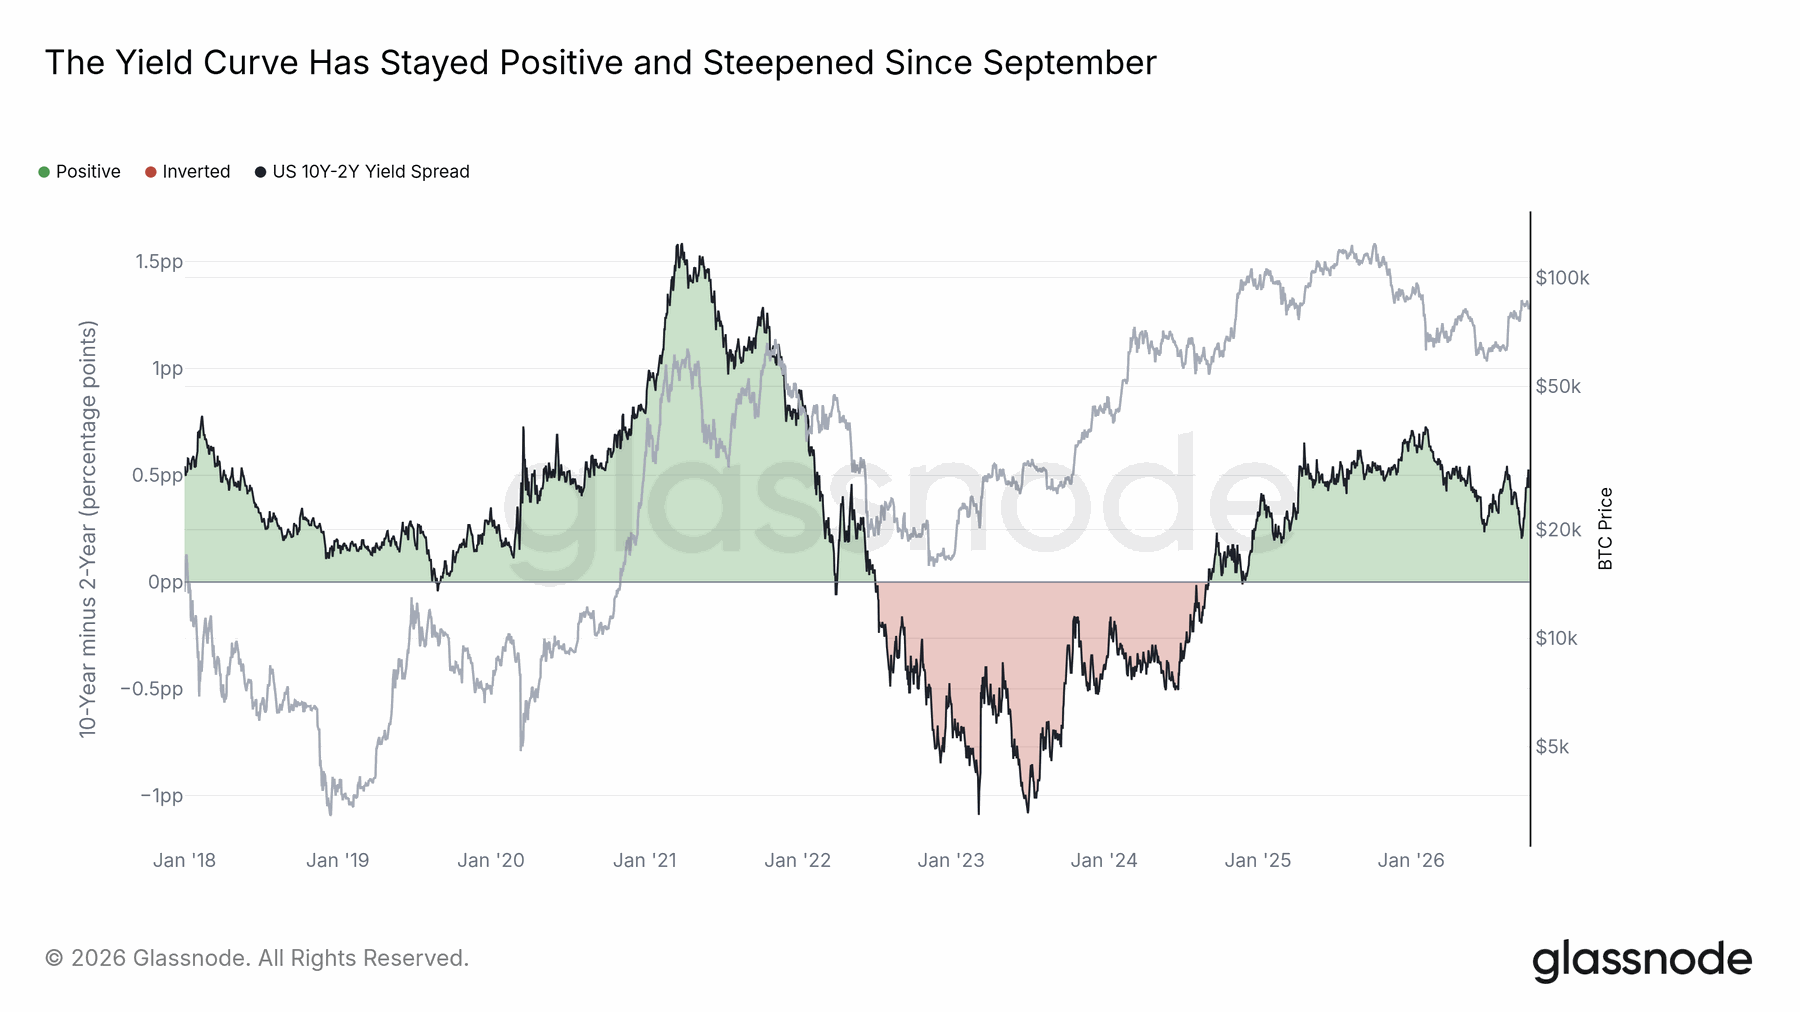
US federal debt passed $40 trillion in the report’s August snapshot. As older, cheaper debt matured, refinancing at higher rates increased the cost of servicing it. The report records a 30-year auction yield of 5.2% in August and a 30-year market yield of 5.6% by October 9. The Treasury’s August 19 announcement increased the maximum size of individual long-dated buybacks from $2 billion to at least $4 billion.
Long yields initially fell but subsequently rose again. The report interprets the intervention as a policy signal; the observed reversal shows why that signal should not be treated as a lasting ceiling on yields.
03 / Macro backdrop
Bitcoin’s relationship with gold strengthened
Bitcoin’s recent behaviour looked more like a hard asset, but the report stresses that correlations can change.
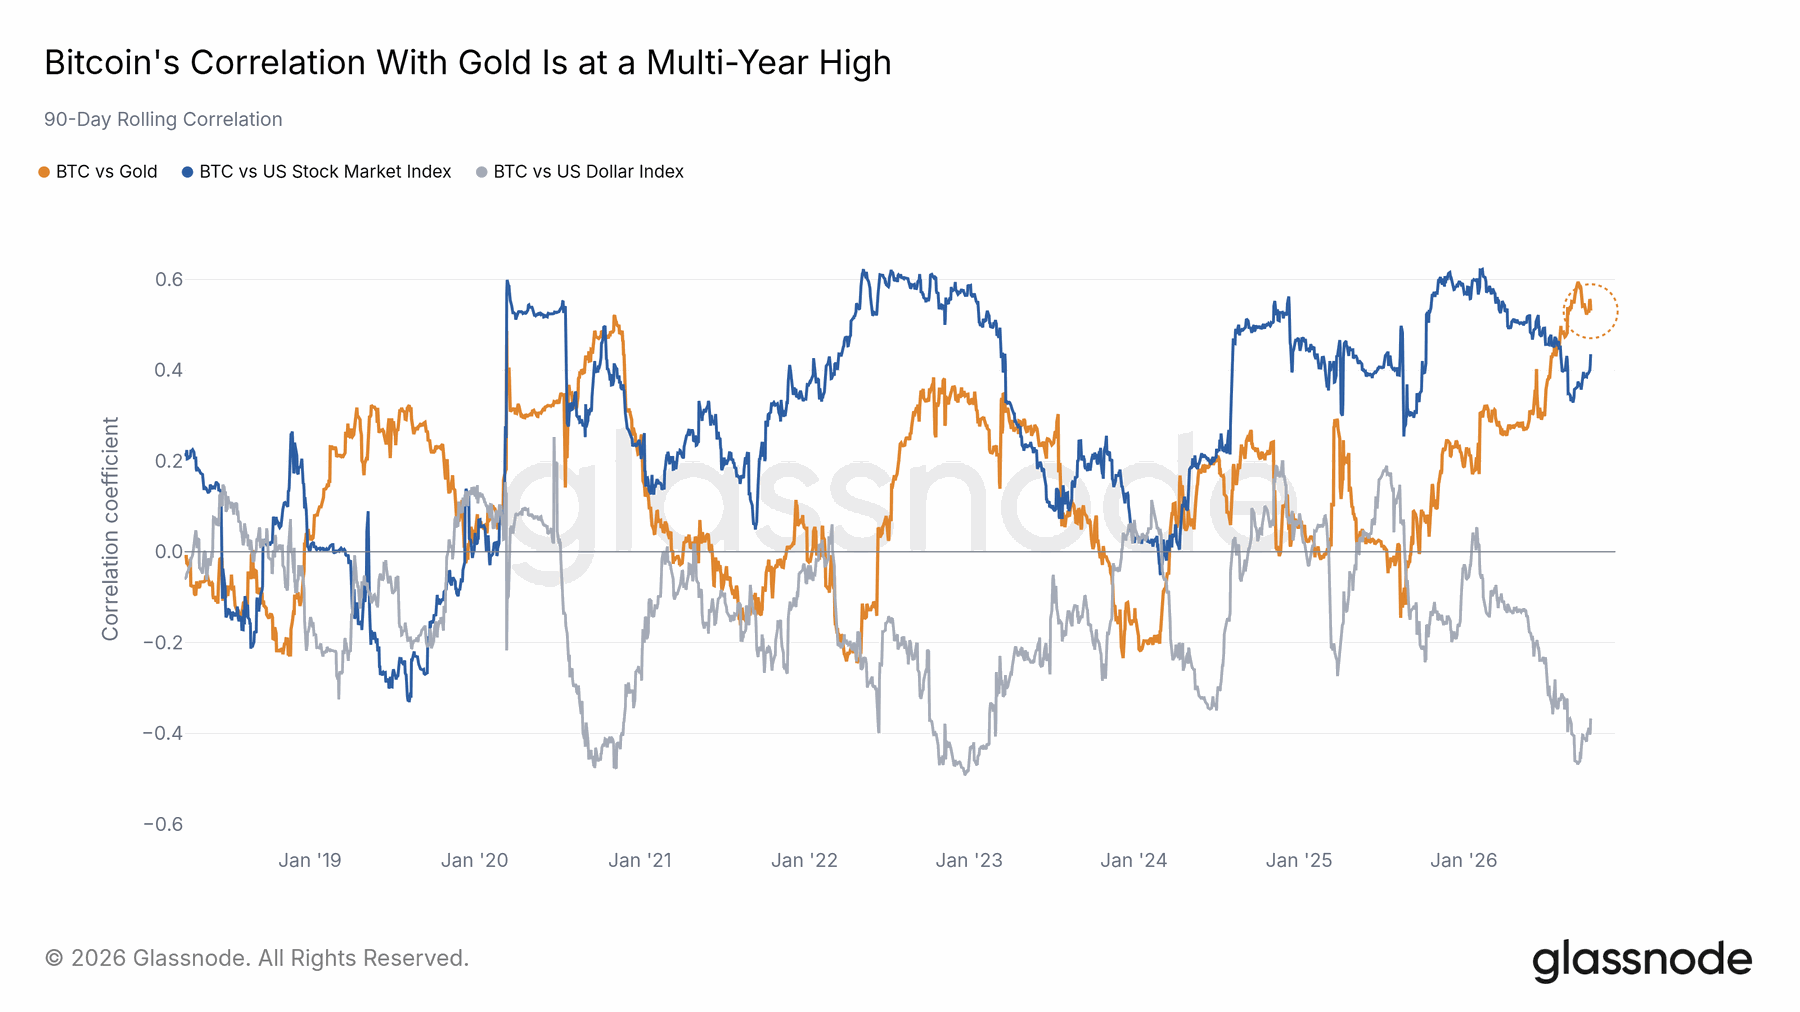
For much of the cycle, Bitcoin moved with equities and amplified their swings. In the report’s 90-day comparison, its correlation with the S&P 500 peaked in February 2026, while its average relationship with gold had been close to zero. The pattern changed around August. The gold correlation reached its highest reading in the series, which begins in March 2018, on September 11.
Bitcoin’s relationship with the dollar was also unusually negative. A useful next test is whether that pattern survives after the August squeeze moves out of the rolling calculation; one event can influence a correlation for months.
04 / Market overview
Capital remained concentrated in Bitcoin
Bitcoin accounted for 57% of the digital-asset market in the report, while Ethereum’s share was about 11%.
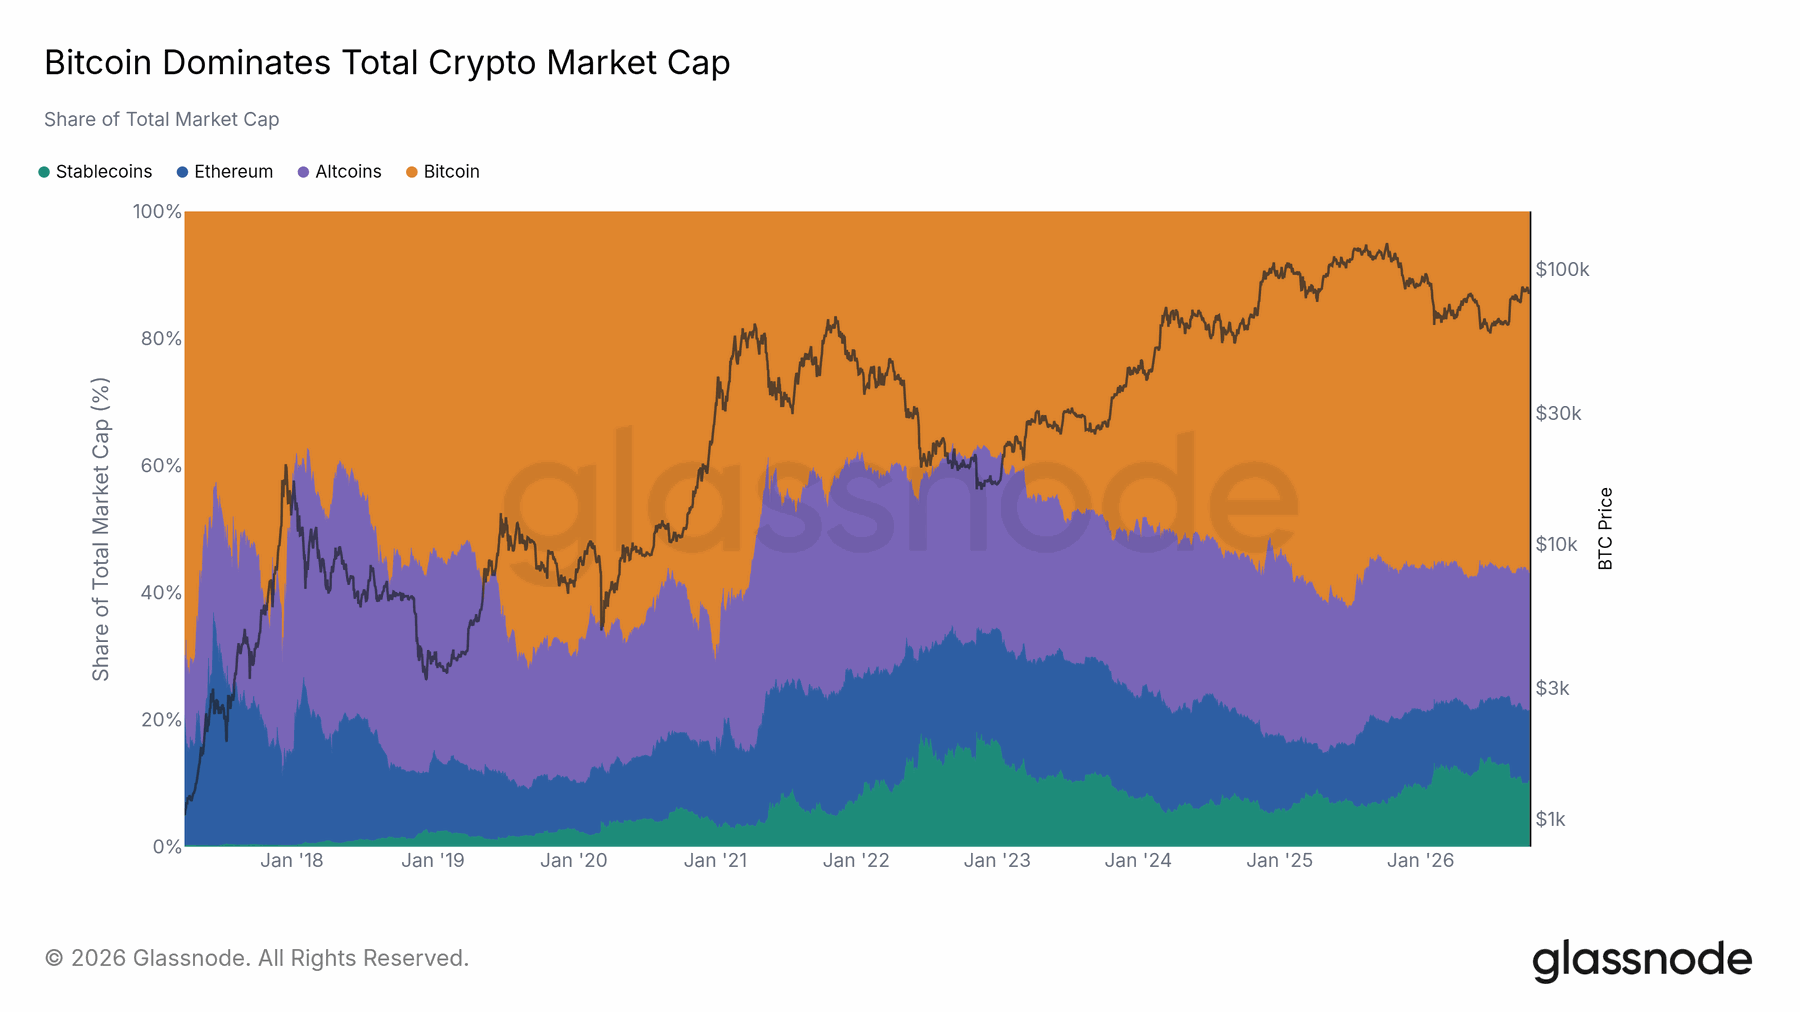
Bitcoin was still roughly 34% below its October 2025 high of $124,700 in this snapshot. Trading activity had thinned during the decline, and smaller assets generally performed worse. The increase in Bitcoin’s market share indicates a preference for the market’s largest and most liquid asset. Stablecoins were the only other broad group to gain share.
Some of that increase came automatically because stablecoin supply held up while volatile assets lost value. Rising dominance is therefore not, by itself, proof of fresh investment. It is important to separate changes in token supply from changes in other assets’ prices.
05 / Market overview
The cycle brought limited capital rotation
Bitcoin’s strongest monthly realized-cap increase exceeded Ethereum’s best month by more than two times.
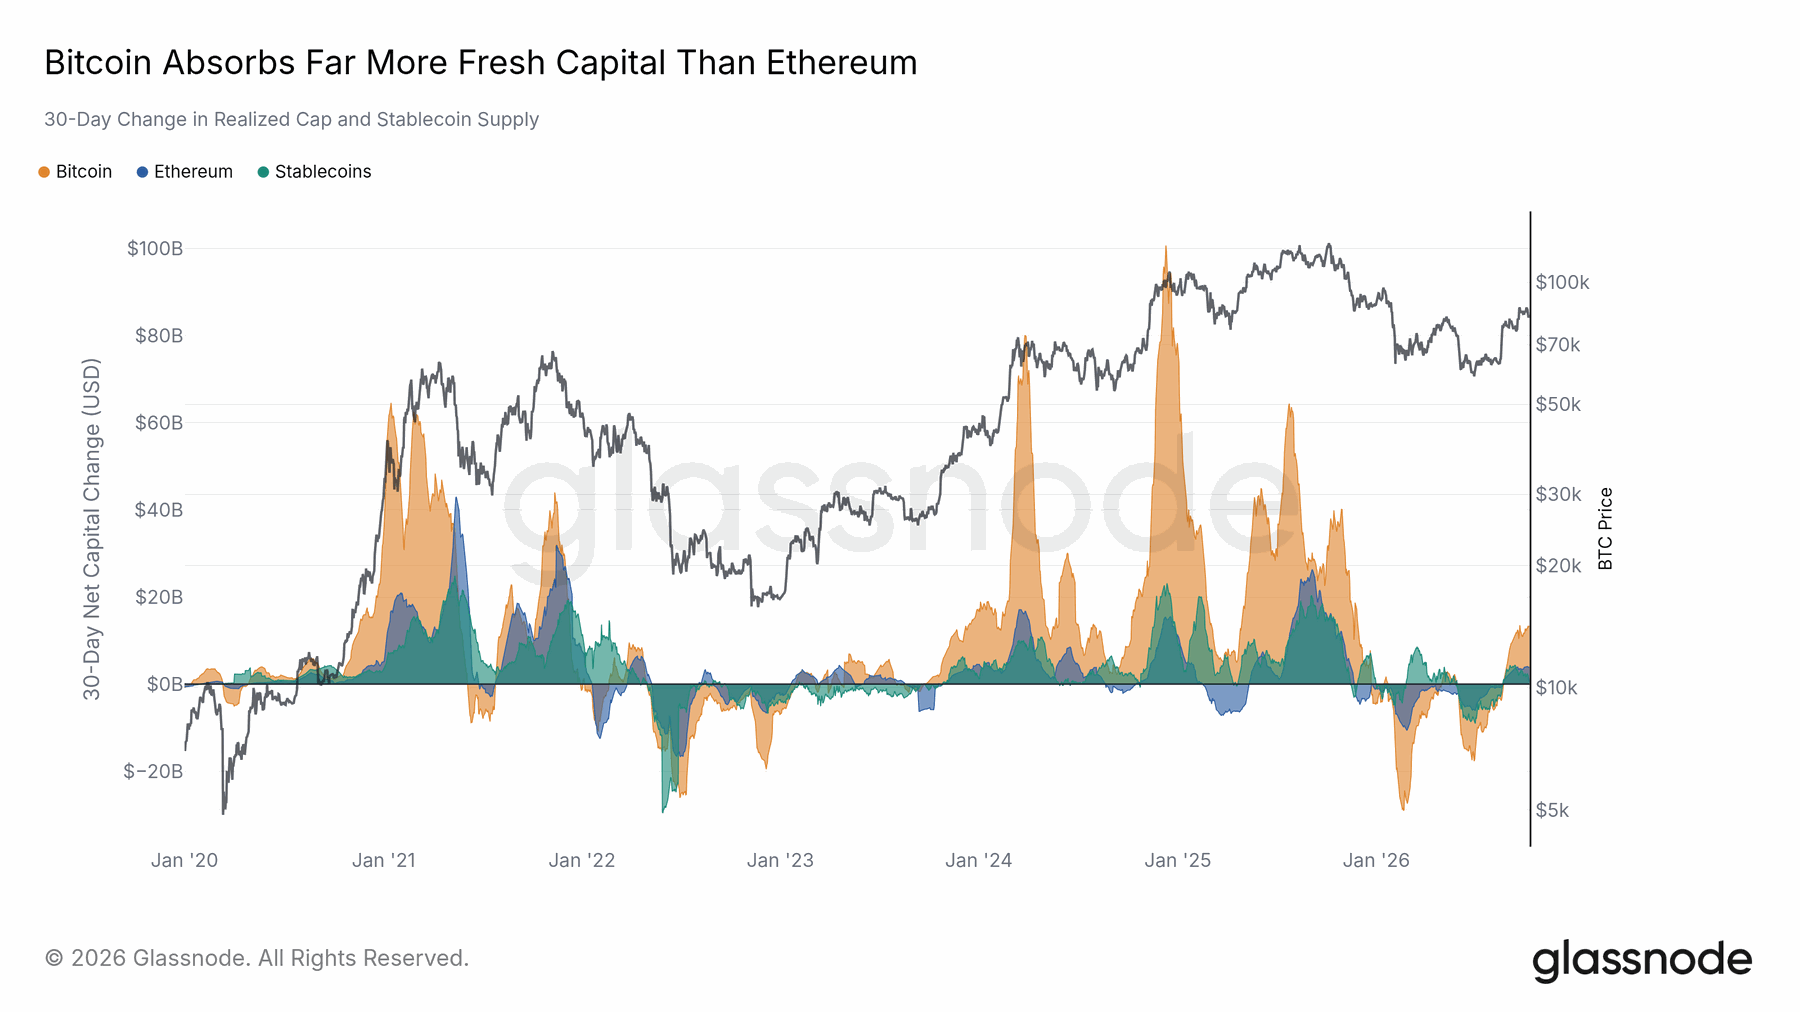
The report records a peak 30-day Bitcoin realized-cap increase of $101 billion in December 2024. Earlier cycles often saw activity broaden from the largest assets into smaller ones. This cycle’s measures instead show much of the expansion remaining concentrated in Bitcoin. The 2026 reversal included a roughly $29 billion decline over one February window.
The measure turned positive again in August and remained positive at the report date. Realized-cap changes are an on-chain proxy for capital conditions, not a direct count of cash entering an exchange, so they are most useful alongside price and trading evidence.
06 / Market overview
The recovery was not equally broad
Smaller assets suffered more during the drawdown, making market breadth an important test of the rebound.
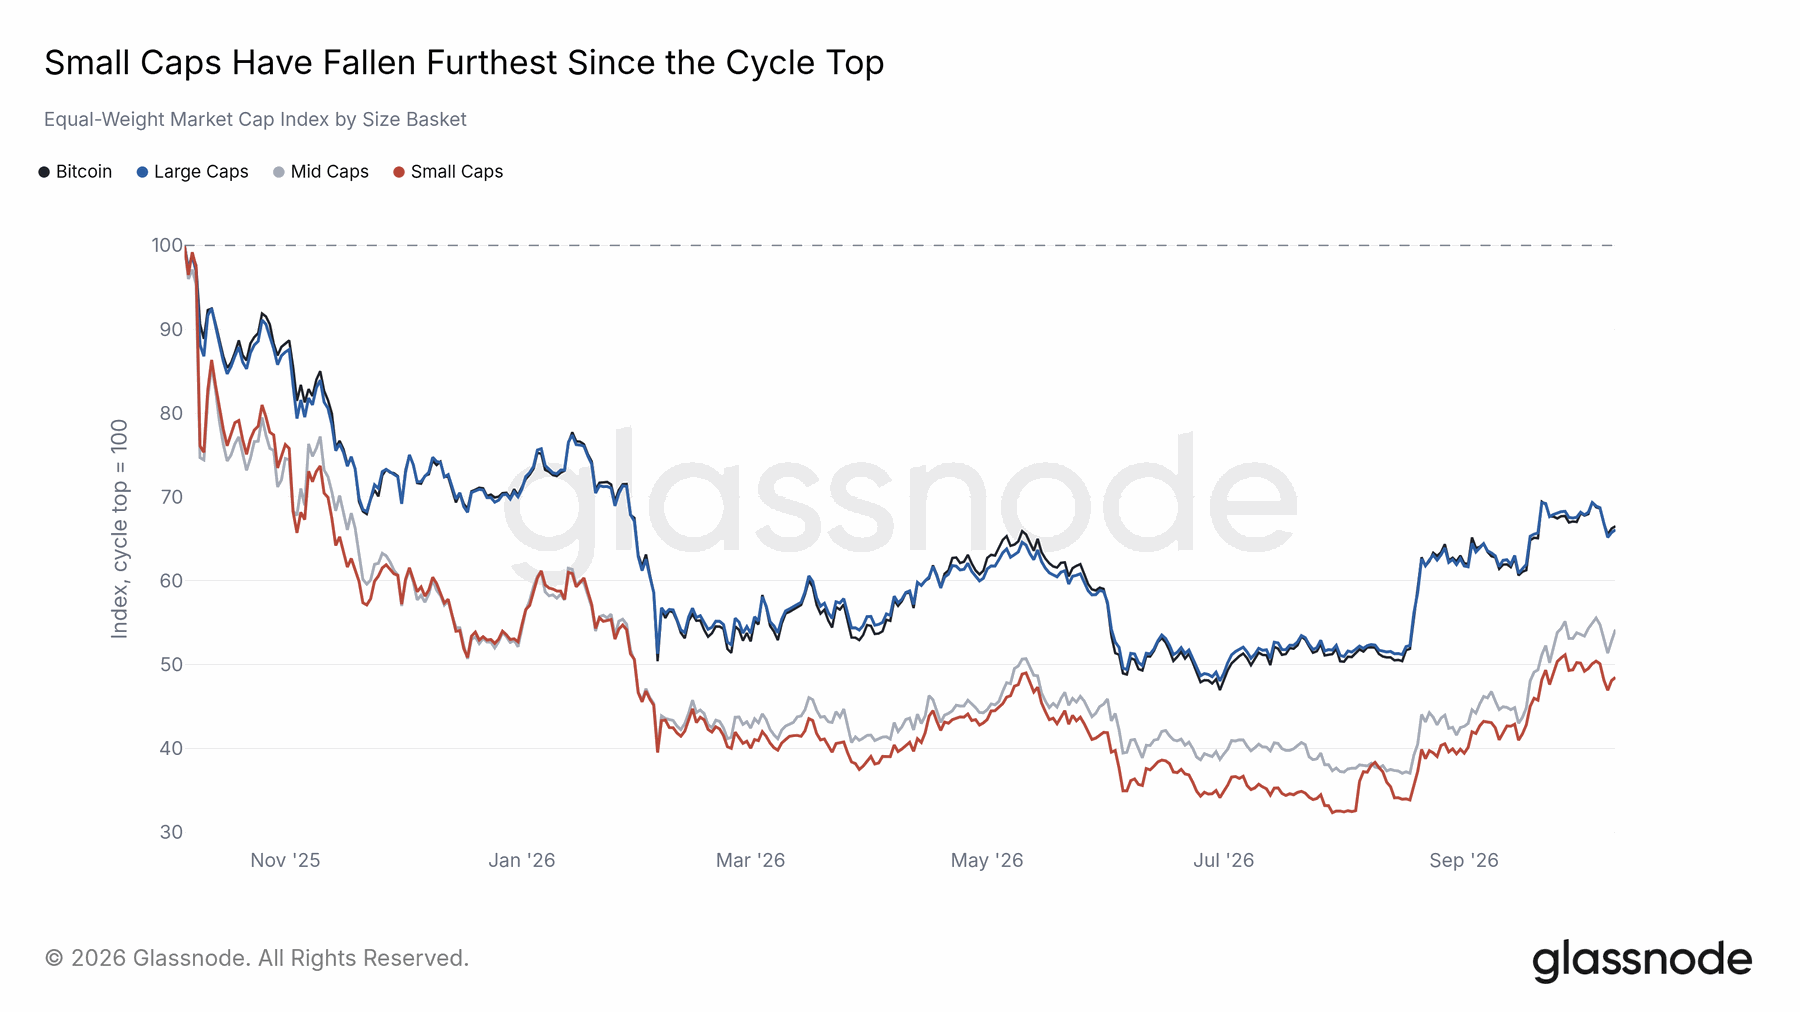
Glassnode’s equal-weight large-cap basket fell by about as much as Bitcoin from the October 2025 top. The small-cap basket was down 52% in the report’s comparison, leaving an approximately 18-percentage-point gap between the large- and small-cap groups. Every basket had recovered from its summer low, but a rebound across all groups does not necessarily mean leadership has broadened.
A narrowing performance gap would be stronger evidence of renewed appetite for smaller assets. A persistent gap would indicate that investors still prefer the largest names and easier trading conditions.
07 / On-chain capital
Capital conditions improved after a long contraction
Bitcoin’s realized cap remained below its peak, but August ended a long sequence of negative monthly readings.
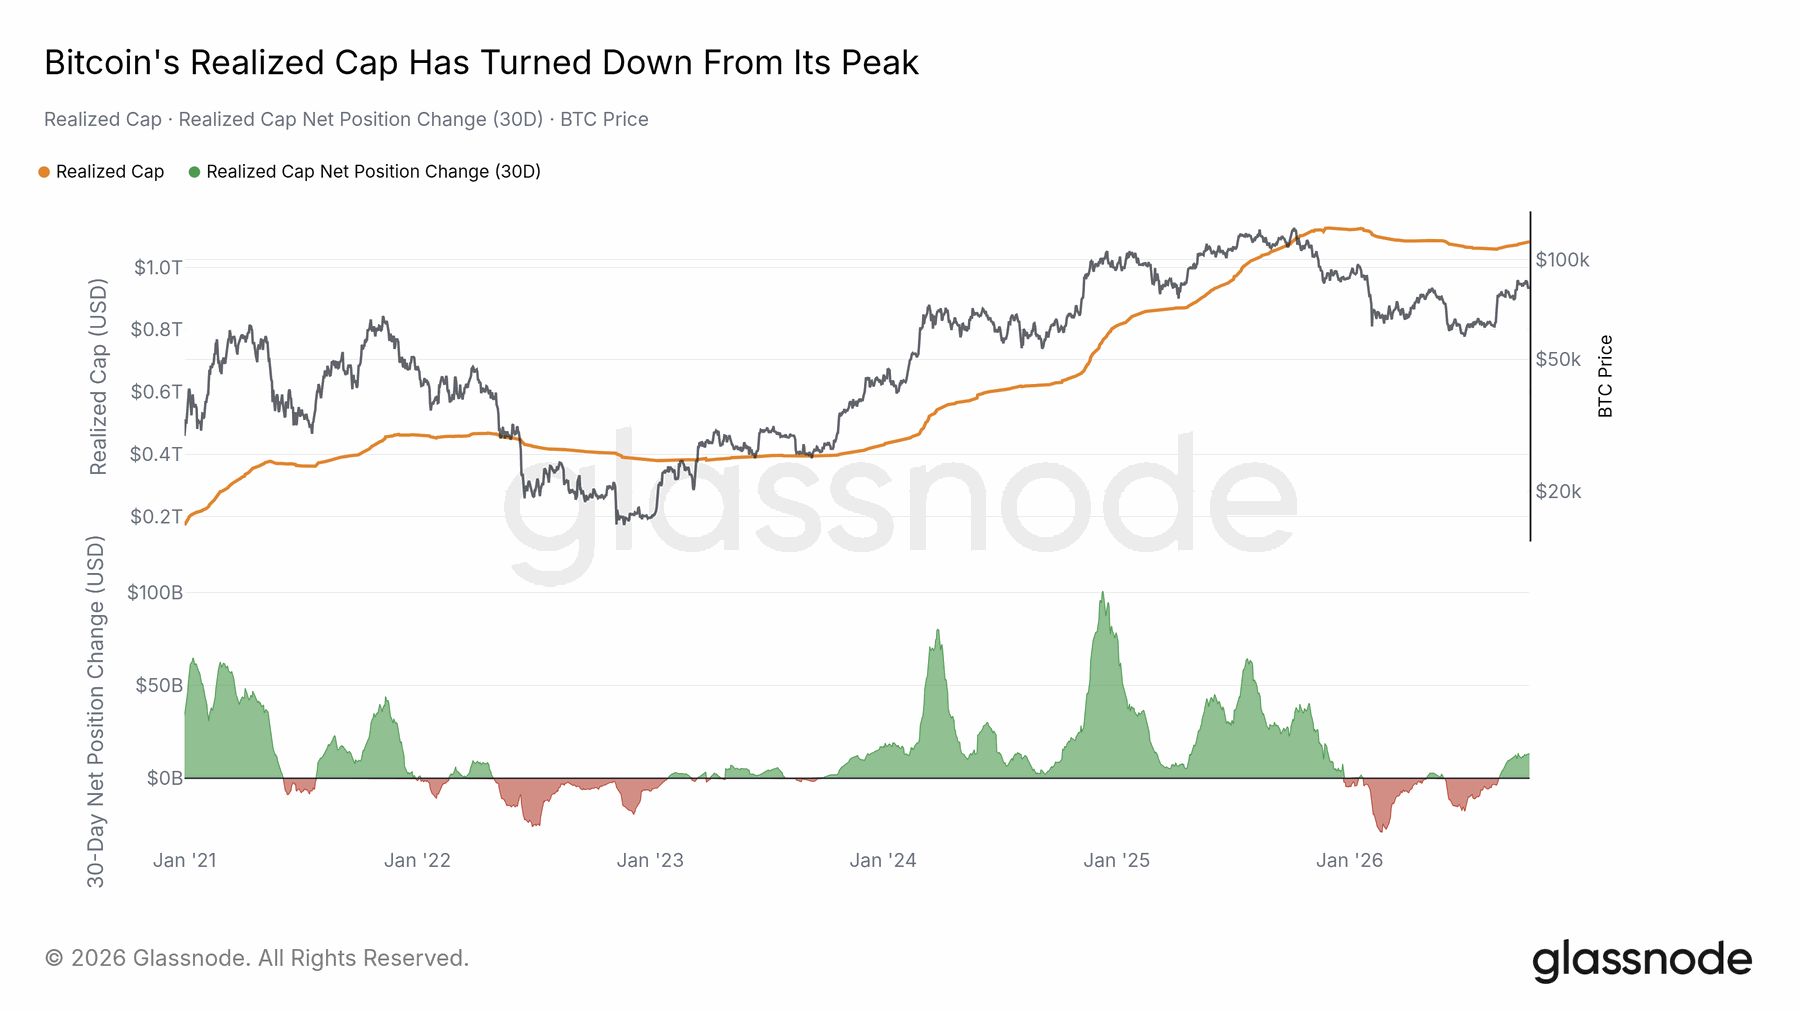
Realized cap values coins at the market price when they last moved on-chain. It offers a different view from market capitalization, which values all coins at the latest price. The report puts the earlier realized-cap peak near $1.1 trillion and the subsequent shortfall at $44.5 billion. February’s largest 30-day contraction represented 2.7% of the capital base, less than half the proportional damage at the worst points of the 2018 and 2022 bear markets in the report’s comparison.
Positive readings from August were encouraging; several further positive months would provide stronger evidence that the contraction had ended.
08 / On-chain capital
A larger capital base, with slower proportional growth
The cycle’s dollar expansion was substantial, although the proportional step-up between cycles continued to shrink.
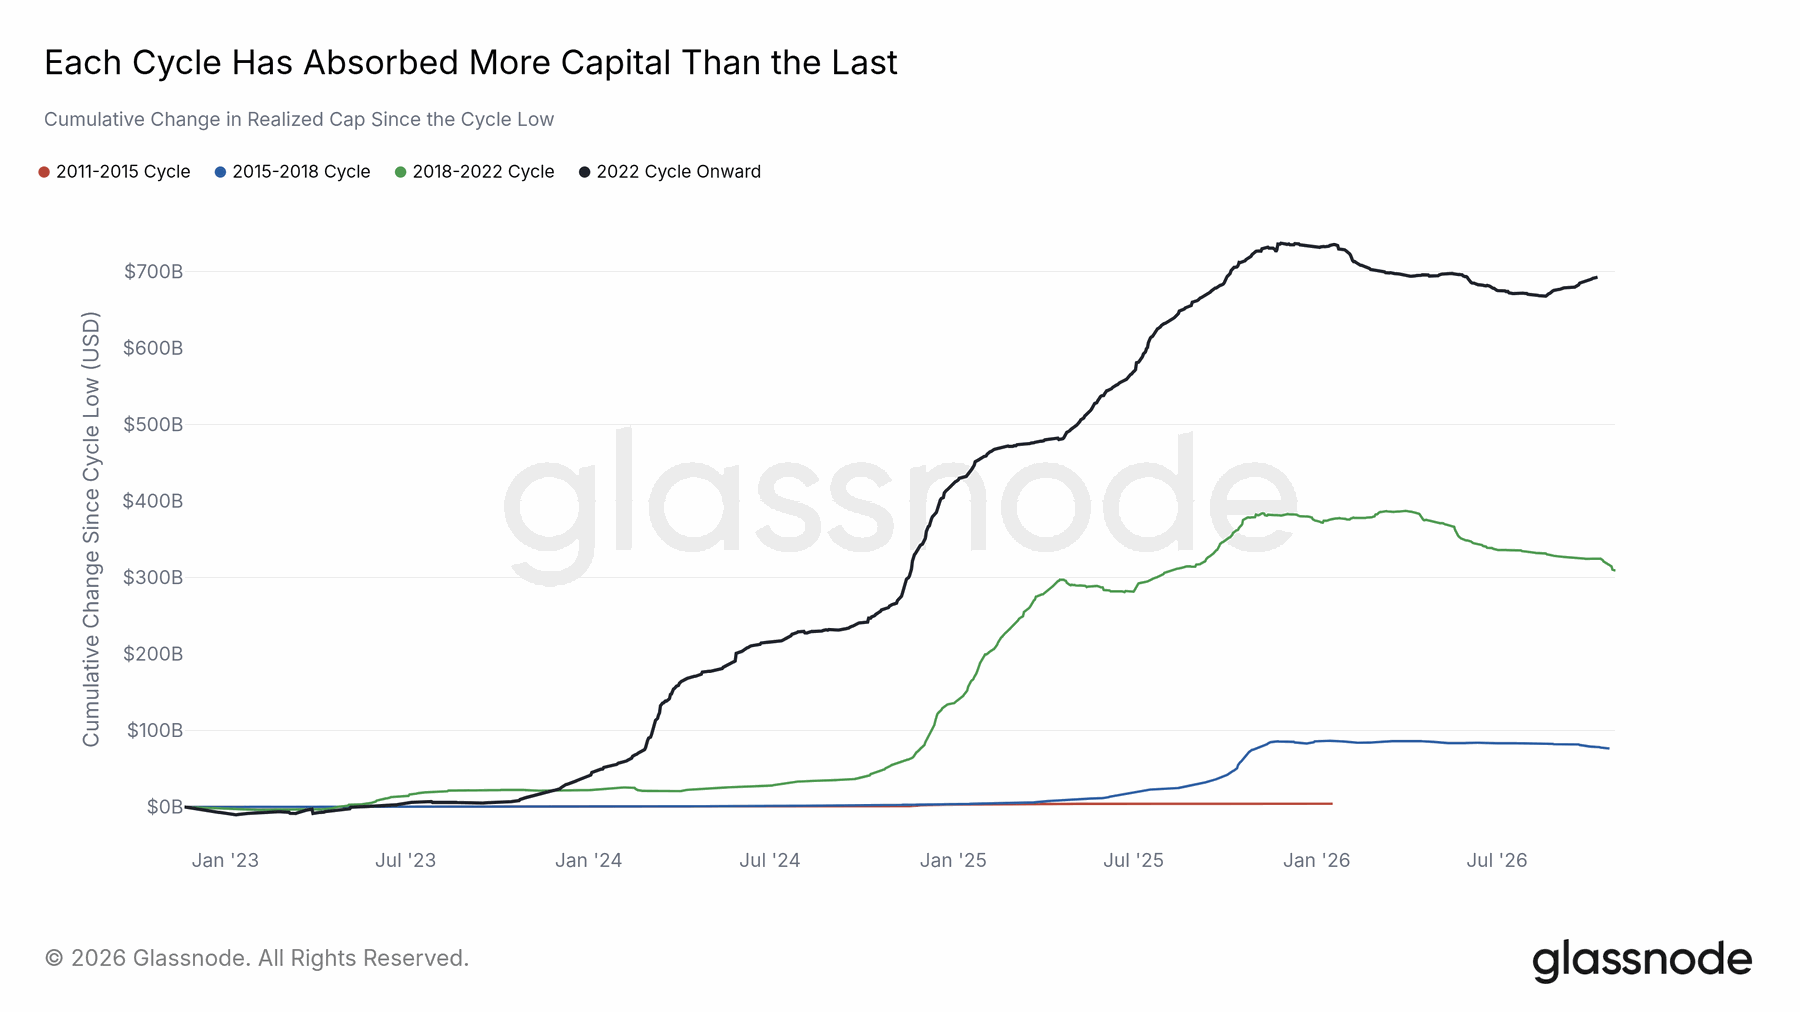
Using its cyclical realized-cap measure, the report estimates a peak addition of $737 billion, more than the prior three cycles combined. Spot ETFs and corporate treasuries provided access channels that were absent in earlier periods. Larger dollar totals are consistent with a much larger asset market. The measure declined to $668 billion in August before recovering to $693 billion.
That improvement alone cannot distinguish a pause inside a longer cycle from the beginning of a new one. The important point is to compare both absolute dollars and growth relative to the existing capital base.
09 / On-chain positioning
Cost-basis levels provide a reference, not a guarantee
Bitcoin had recovered above three major on-chain reference prices in the report’s snapshot.
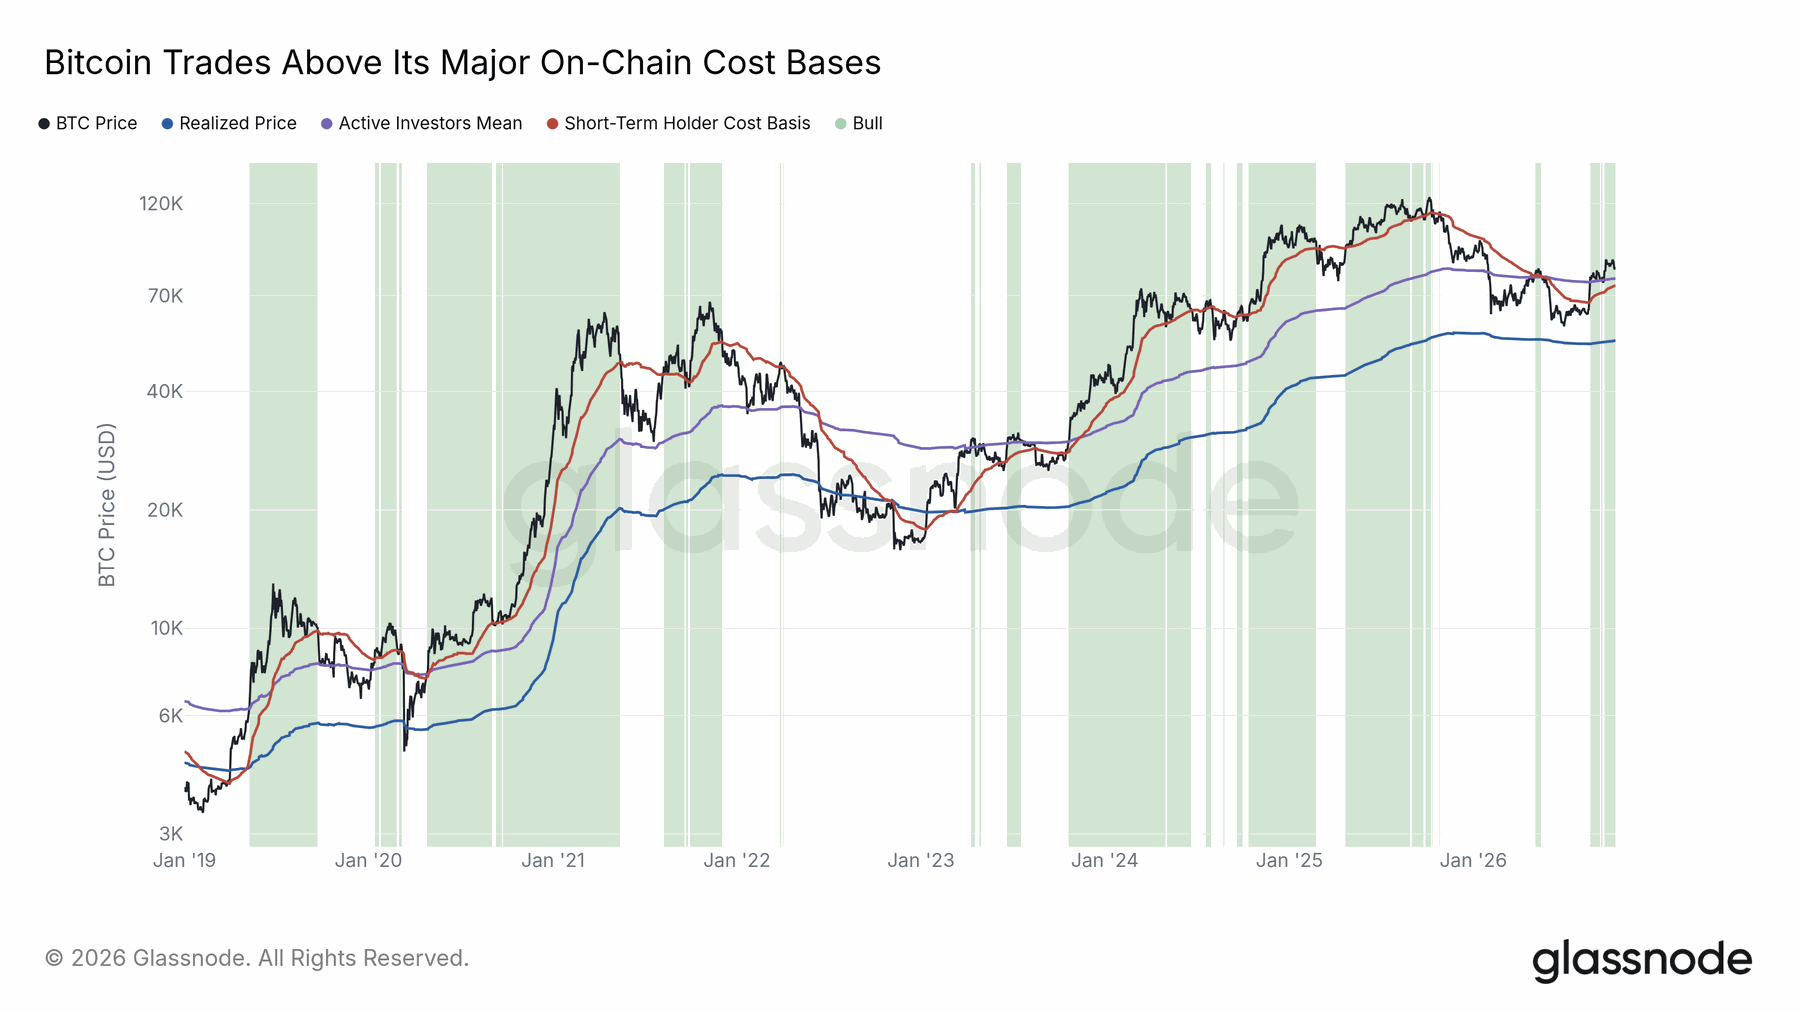
The report lists a realized price near $53,900, an Active Investors Mean near $77,500 and a short-term-holder cost basis near $74,400. The quoted Bitcoin price was about $82,900. These measures describe differently weighted groups of coins; they are not interchangeable estimates of every investor’s actual entry price. Recovering above these references was an improvement from the earlier drawdown.
The report uses them to distinguish stronger and weaker market conditions. A sustained loss of a previously recovered area would weaken that interpretation, but none of the lines prevents further declines or establishes a guaranteed buying opportunity.
10 / Risk conditions
A quiet market can still move sharply
The calmest short-term volatility reading preceded the August squeeze by only a few days.
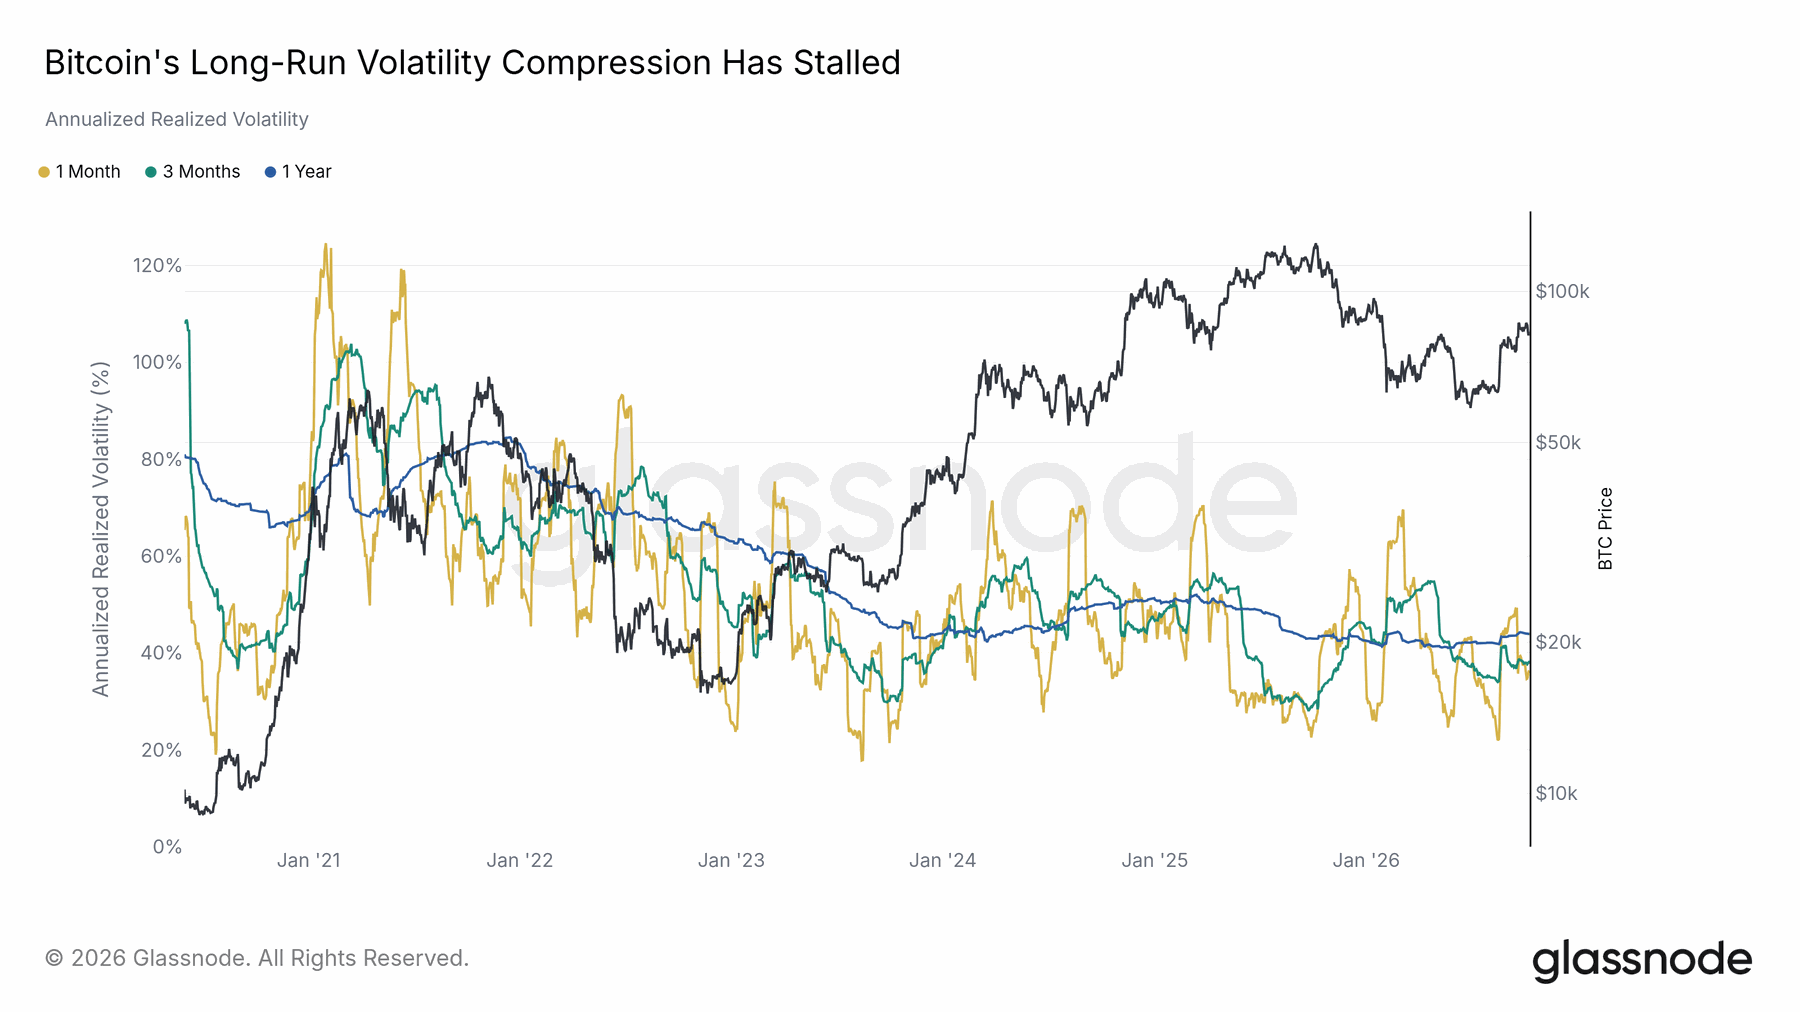
One-year realized volatility was 43.9%, close to the 43.0% reading a year earlier. The report argues that the earlier long decline in Bitcoin volatility had stalled. Shorter windows told a more dramatic story: one-month realized volatility reached a cycle low of 22% on August 16. The squeeze began three days later, and short-term volatility rose above the one-year measure before easing to 35.9%.
Low recent volatility describes what has happened; it does not establish that future risk is low. It is especially important to consider positioning and liquidity when recent trading has been unusually calm.
11 / On-chain positioning
Newer coins gained a larger share of wealth
The recovery in young-coin wealth supported the demand picture without resembling a prior-cycle peak.
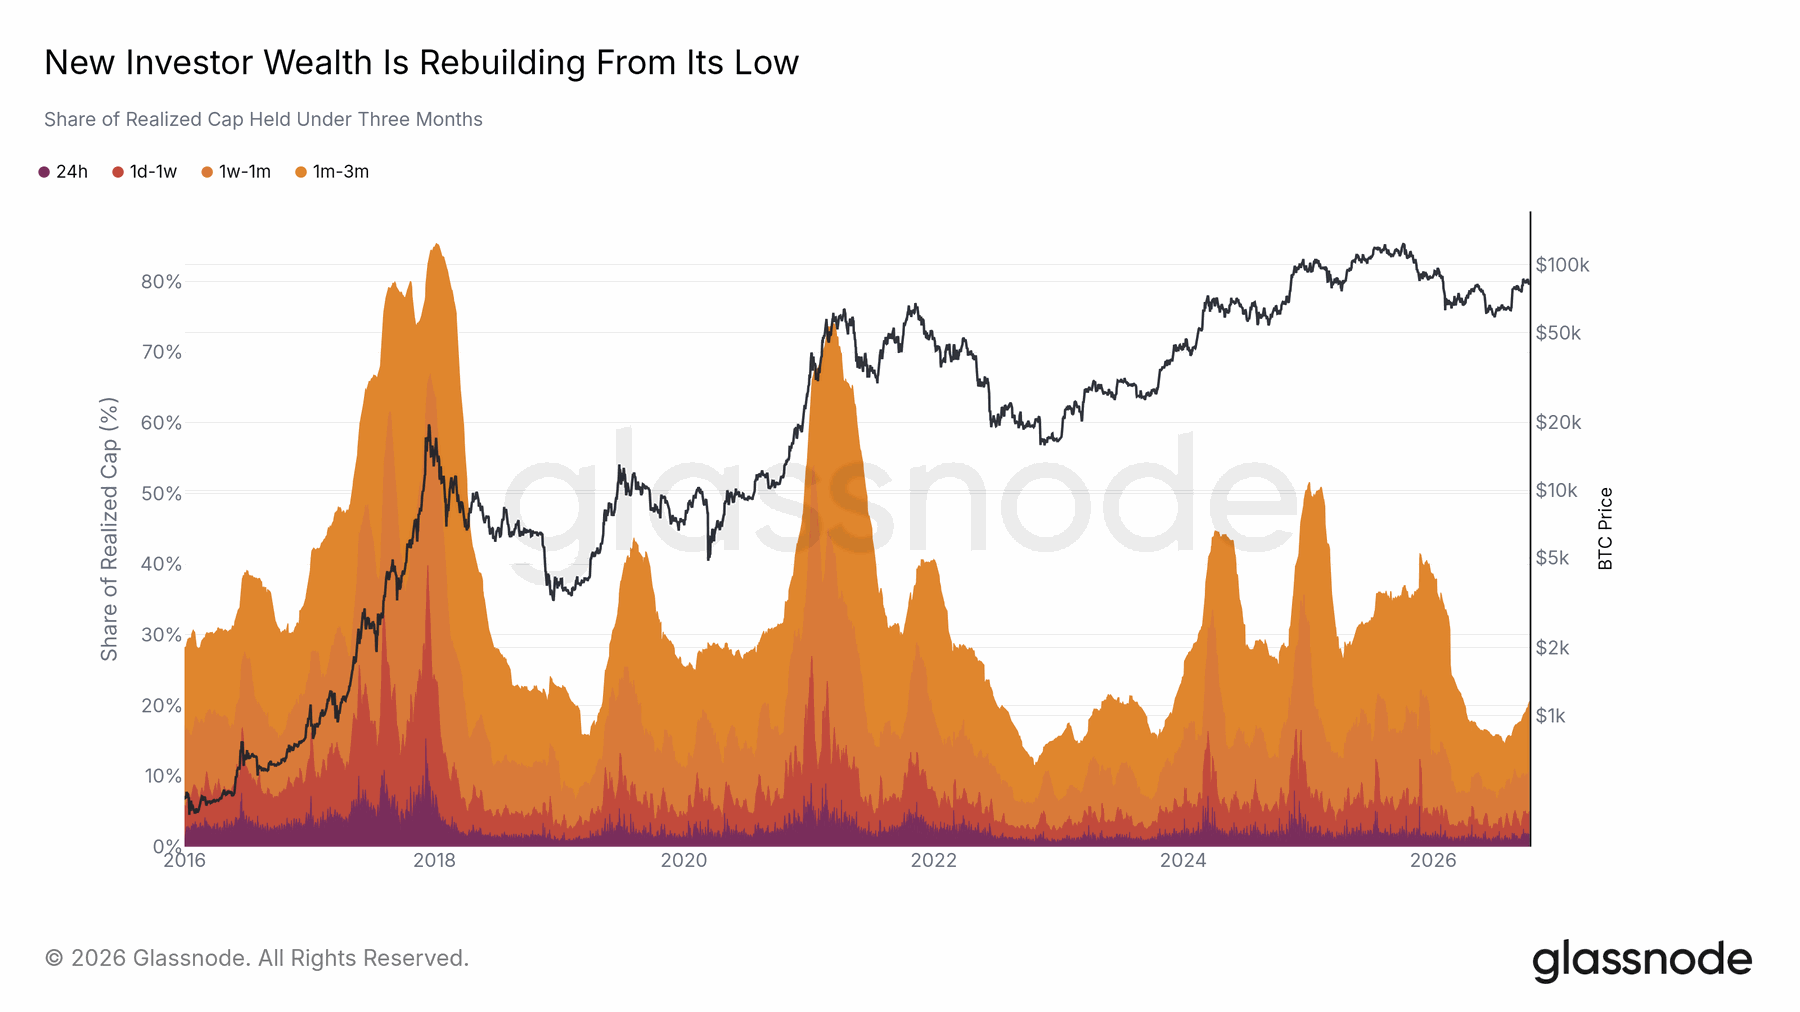
The report uses coins that moved within the previous three months as a proxy for newer market participation. Their share of realized cap reached 37% at the October 2025 high, then fell into a range associated with earlier bear-market lows. By the report date it had recovered to 21%. Much of the increase appeared in the one-to-three-month band, consistent with coins acquired around August remaining unmoved.
Coin age is not the same as a count of new people, and transfers do not always represent purchases. Even so, the change adds context to the price rebound and is more informative when confirmed by other demand measures.
12 / On-chain positioning
Cycle indicators moved from cold toward neutral
The market had left its most depressed indicator readings without moving into broad overheating.
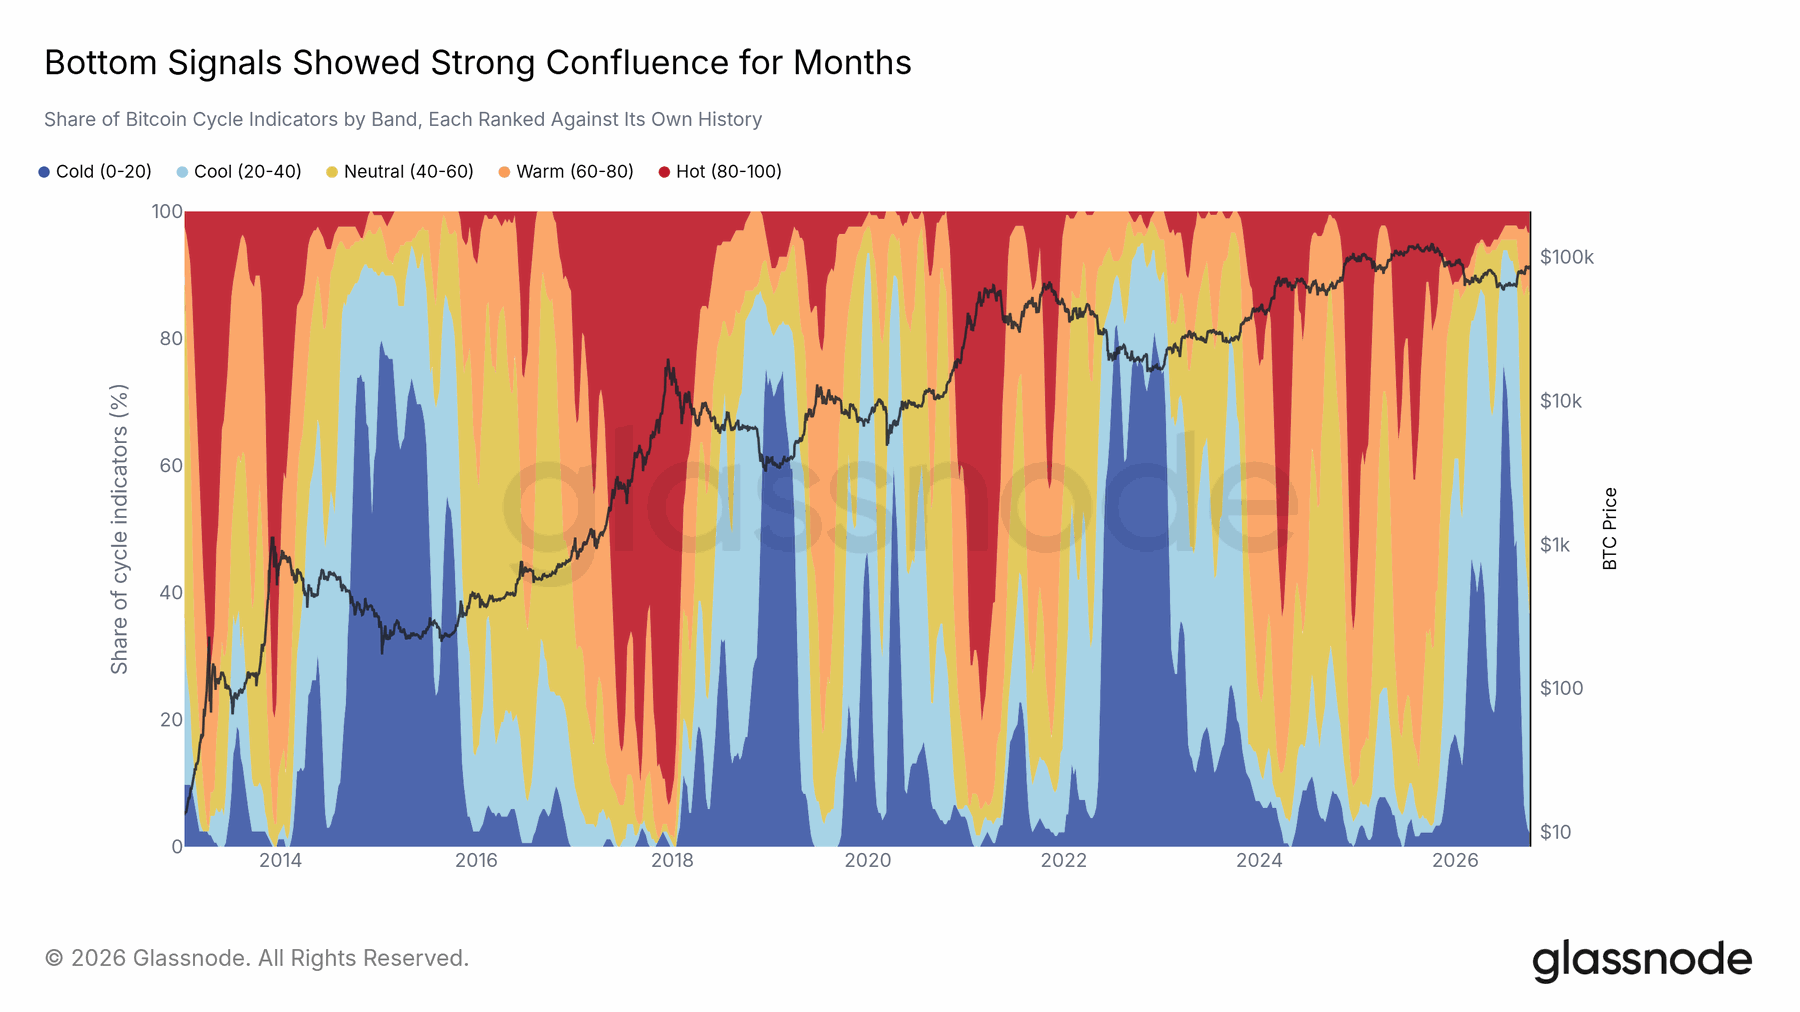
Glassnode’s Market Compass ranks 45 indicators against their own histories and groups them into five temperature bands. Most indicators occupied the two coldest bands for 31 weeks during the drawdown. At the end of June, the Cold band alone contained 82% of the readings. In the week of October 5, the largest group, 56%, was Neutral, with fewer than one fifth Warm or Hot.
That is an improvement in the report’s framework, not a timing guarantee. Further strengthening would make the recovery more convincing; a sustained return to colder readings would challenge it.
13 / Spot market
Aggressive selling eased across spot venues
The spot-market data showed much less selling pressure, although the latest readings were still negative.
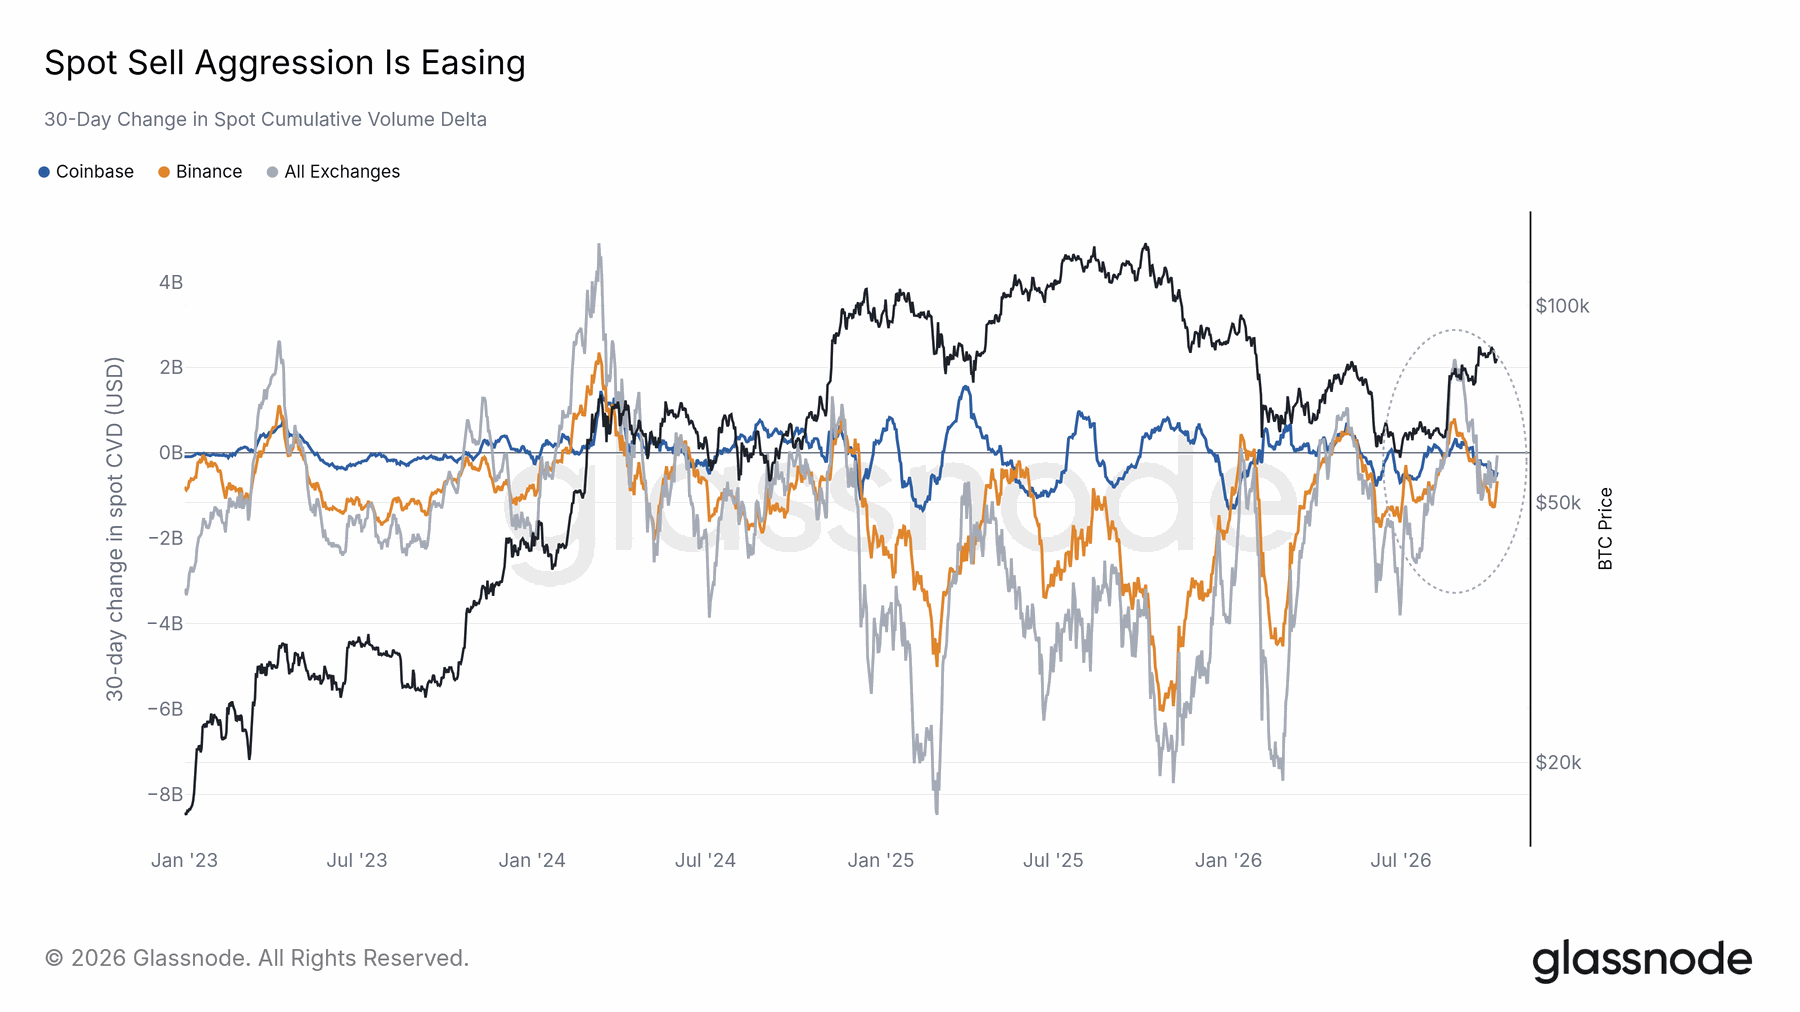
The 30-day change in Spot Cumulative Volume Delta compares buyer-initiated and seller-initiated trading. Positive readings indicate buyers paying up for execution; negative readings indicate sellers accepting lower bids. The report’s all-exchange series averaged about minus $4.2 billion during 2025, with much of the selling pressure on Binance. Over the latest 90 days, the negative average had fallen to less than one tenth of that pace.
Coinbase had been closer to balanced during the earlier period. The latest observations were still below zero across the three displayed series, so reduced selling should be distinguished from sustained aggressive buying.
14 / Order-book liquidity
Order-book recovery differed across venues
Dollar depth and coin-denominated depth can tell different stories after a large price decline.
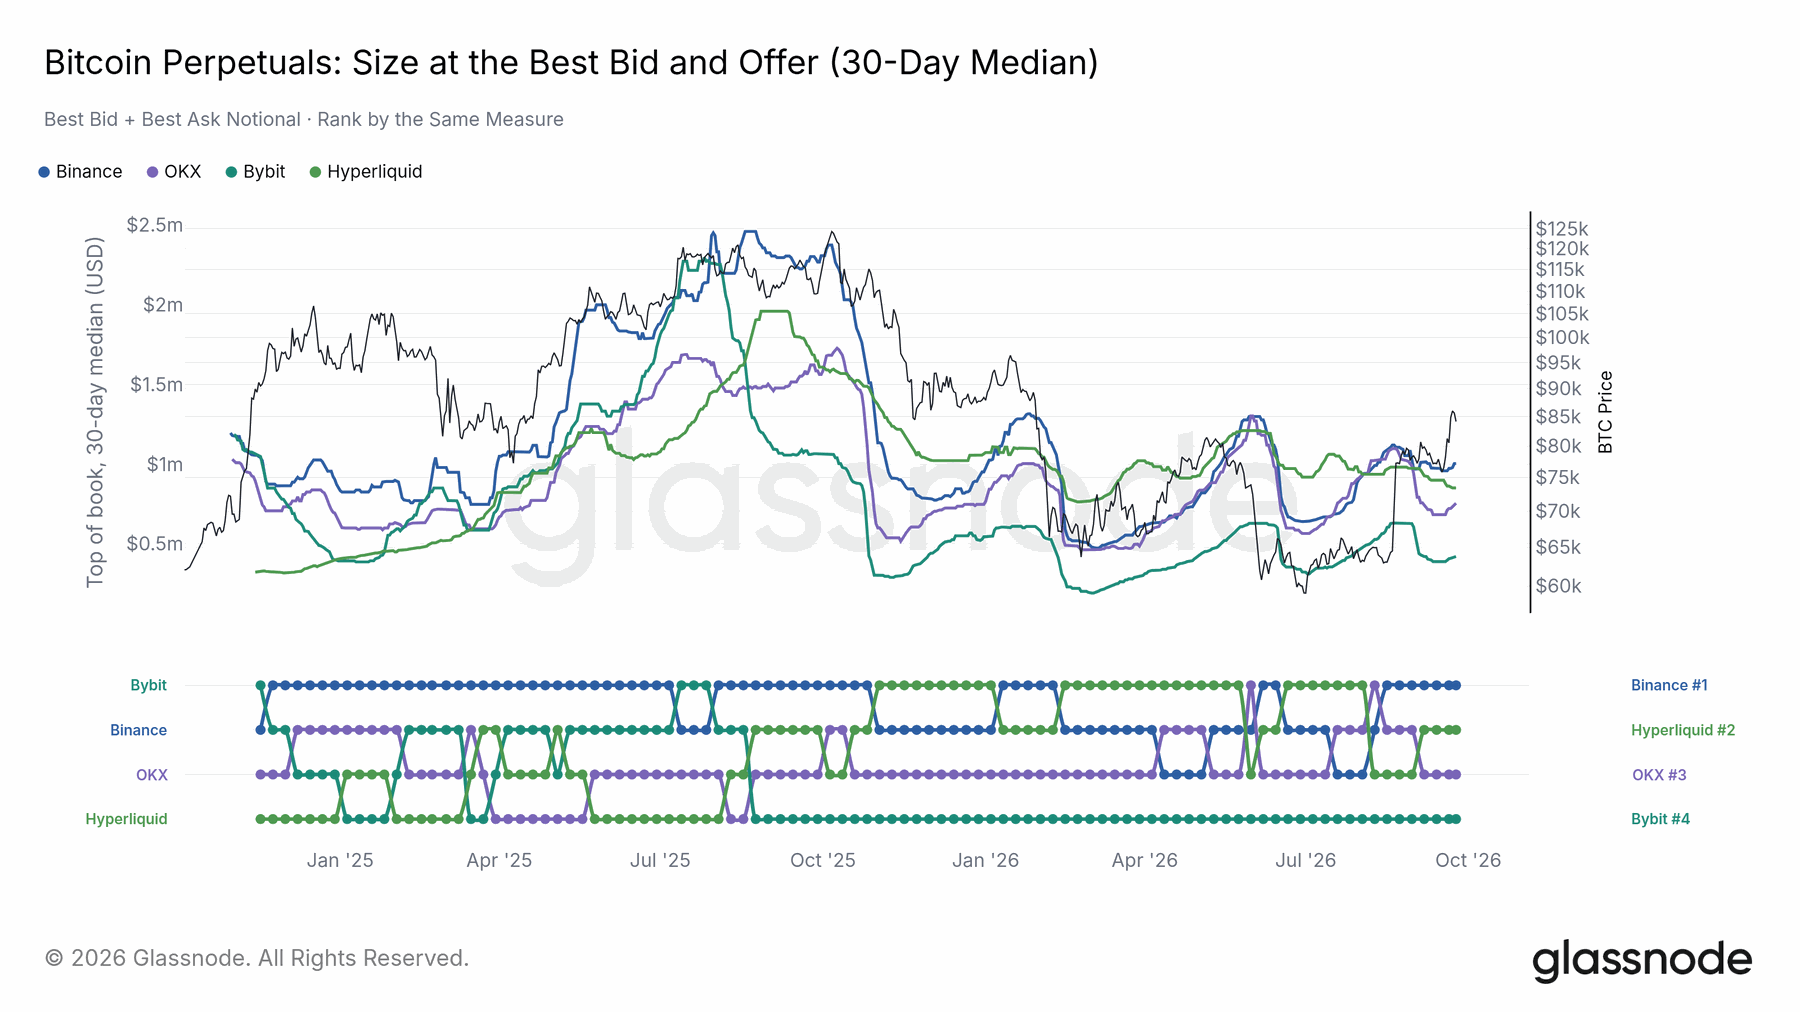
Fasanara measures value resting at the best bid and best offer using repeated order-book snapshots. This is top-of-book liquidity, not the full amount that could trade across many price levels. Lower Bitcoin prices accounted for part of the decline in dollar-denominated depth. Measured in Bitcoin, the report puts Binance’s top-of-book size 34% below Q3 2025, Bybit’s 37% lower and OKX’s 11% lower.
Hyperliquid was much closer to its earlier level, at 13.2 BTC against 14.3 BTC. Comparing both units helps separate changes in price from changes in displayed liquidity.
15 / Order-book liquidity
Depth rankings need a spread comparison
A deep-looking best quote does not necessarily imply the cheapest execution.
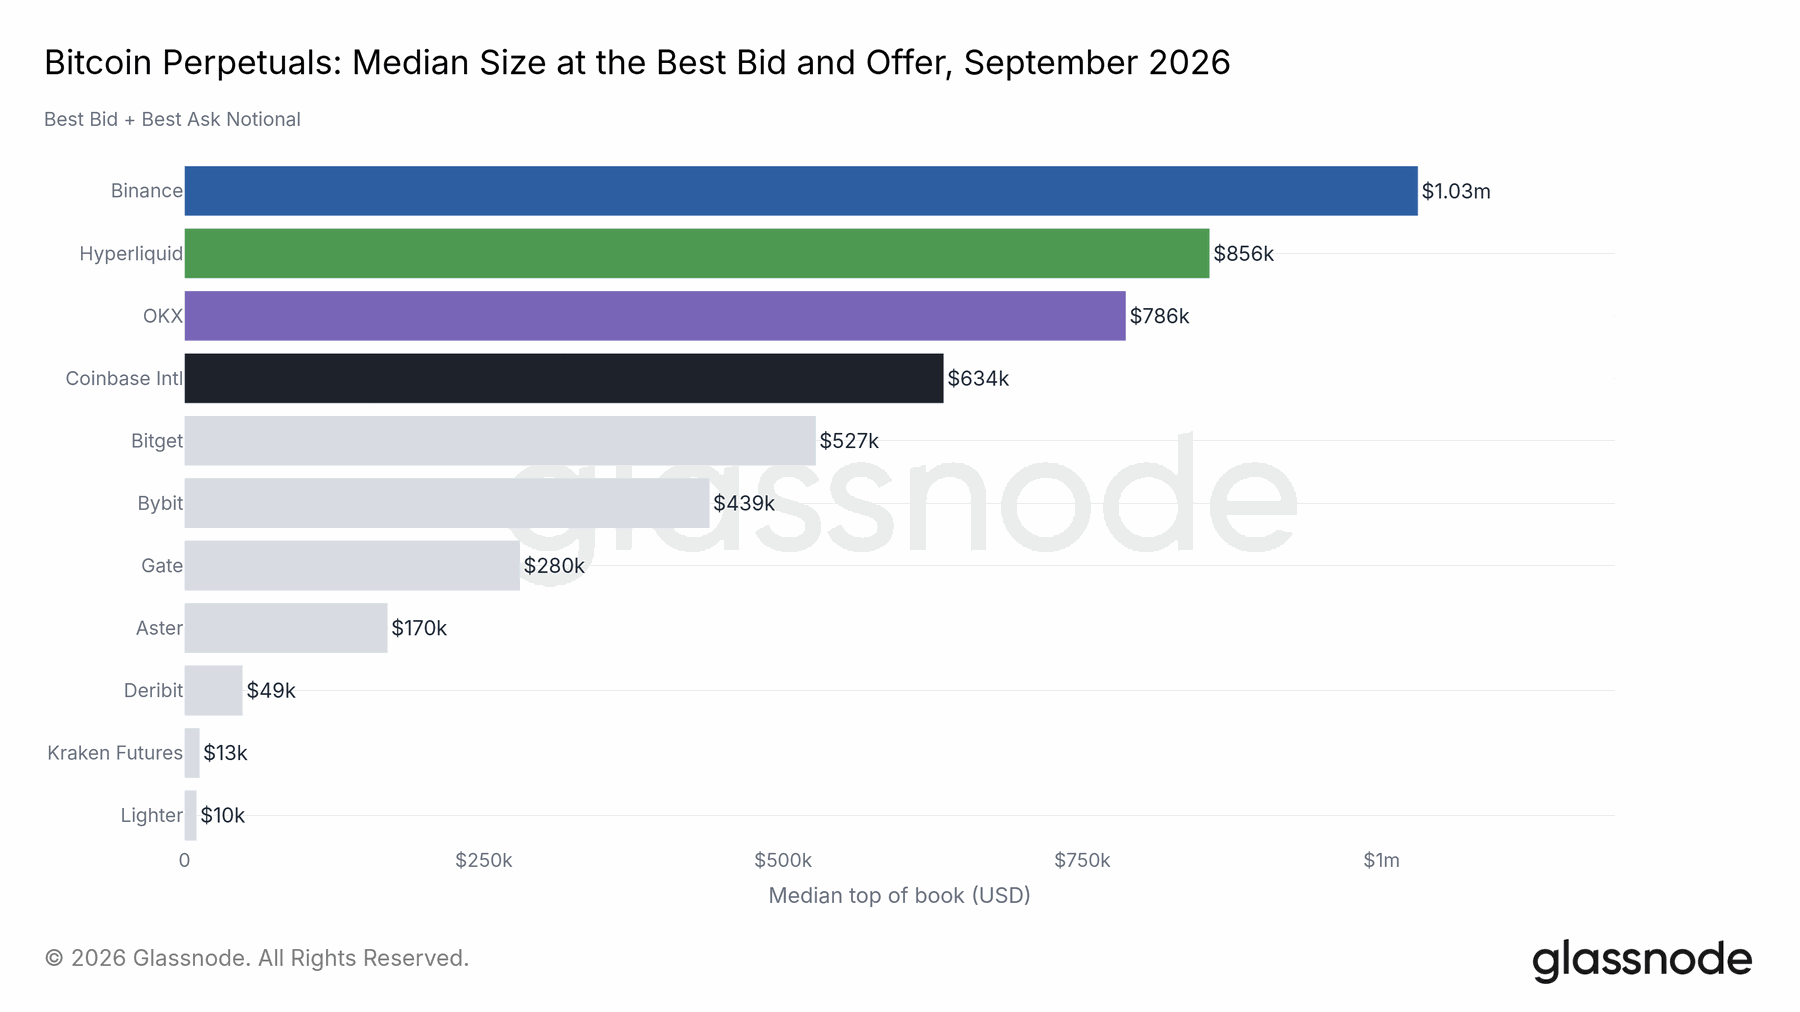
In Fasanara’s September 1–24 sample, Binance led best-bid-plus-best-offer value at $1.03 million. Hyperliquid followed at $856,000, ahead of OKX at $786,000. These observations describe the sampled Bitcoin perpetual contracts and should not be generalized to every instrument on each venue. Hyperliquid’s whole-dollar tick size concentrated orders on fewer levels than Binance’s $0.10 step, while its quoted spread was wider: 0.127 versus 0.013 basis points.
The report’s small-order execution examples show why order size, spread and deeper-book liquidity matter together. A single depth ranking cannot answer every execution question.
16 / Order-book liquidity
Equity perpetuals carried heavy flow on thin quotes
Strong turnover can coexist with very little size resting at the best prices.
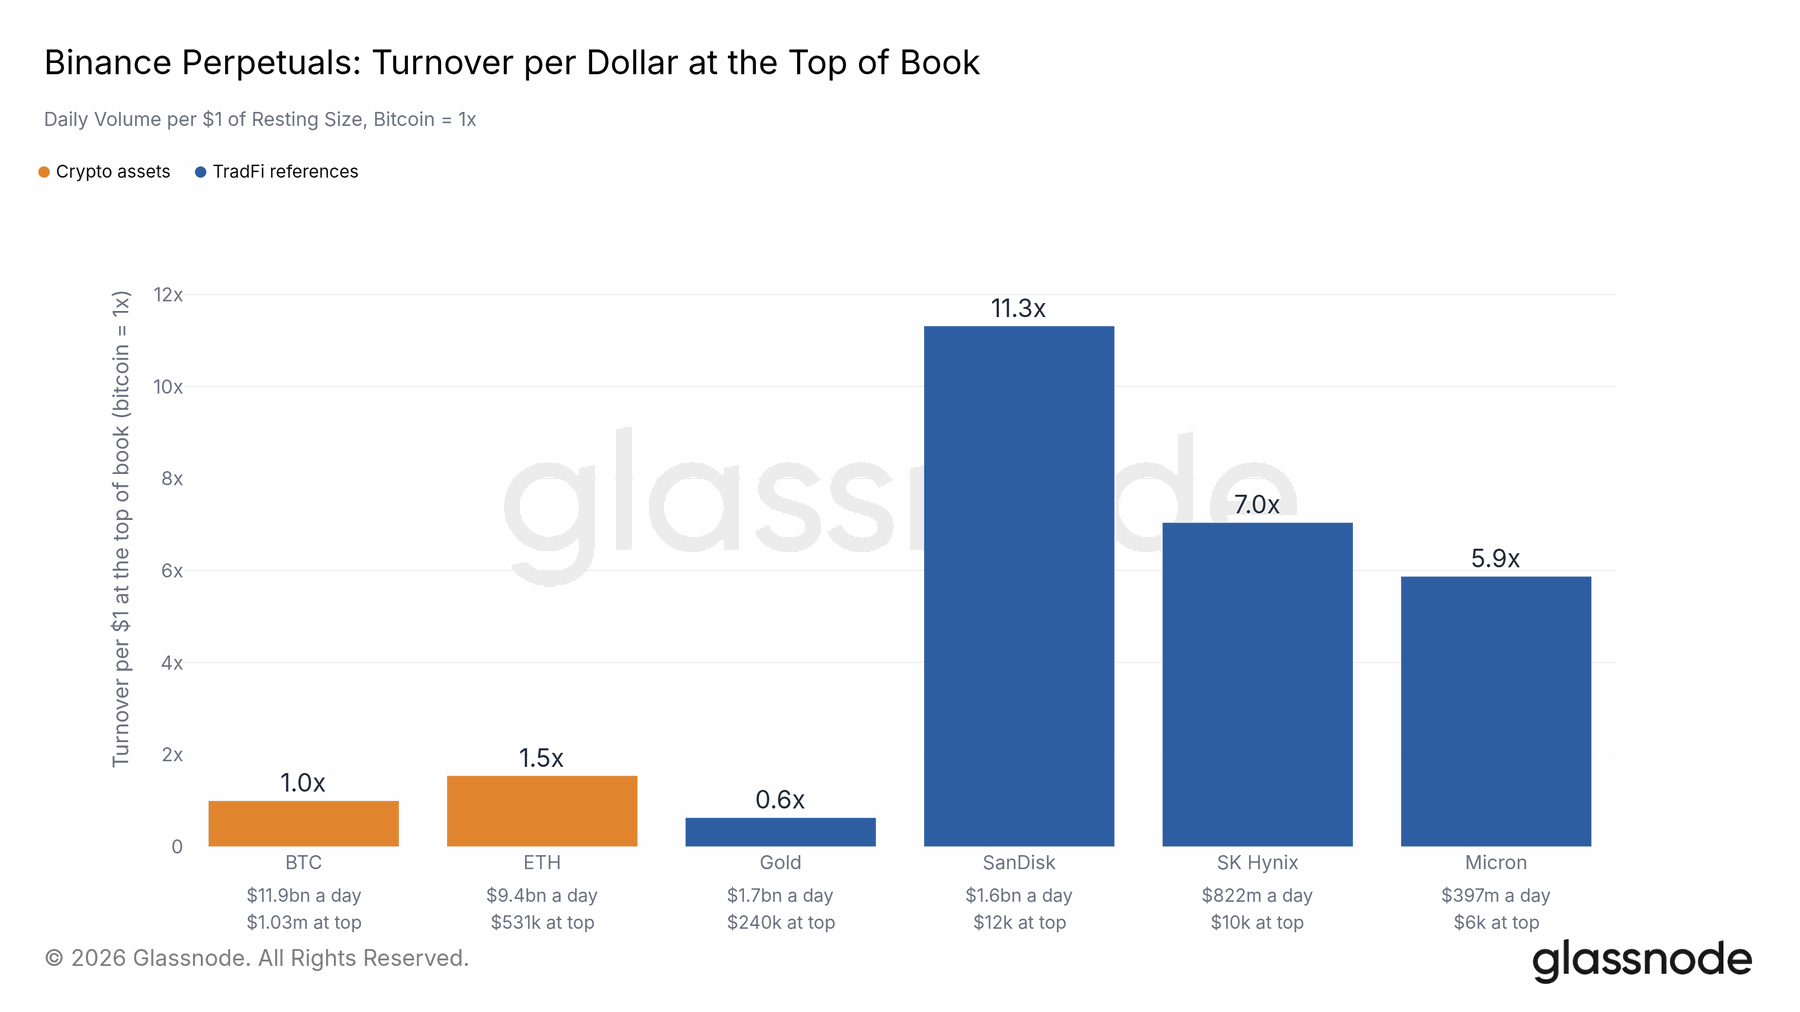
Fasanara compares average daily volume with median top-of-book value. Bitcoin on Binance traded about $11.9 billion a day against $1.03 million at the best quotes. SanDisk perpetuals traded about $1.6 billion against only $12,000, producing roughly eleven times more turnover per dollar of displayed size. A high ratio is not a literal count of how often the same orders traded.
Market makers can cancel and replenish quotes rapidly. The comparison highlights an execution constraint: a large immediate order may encounter much less available size than daily volume suggests. The report recommends working larger orders rather than assuming headline volume guarantees an easy fill.
17 / Derivatives
Futures exposure fell and shifted between venues
The decline in dollar open interest reflected both lower prices and the closing of positions.
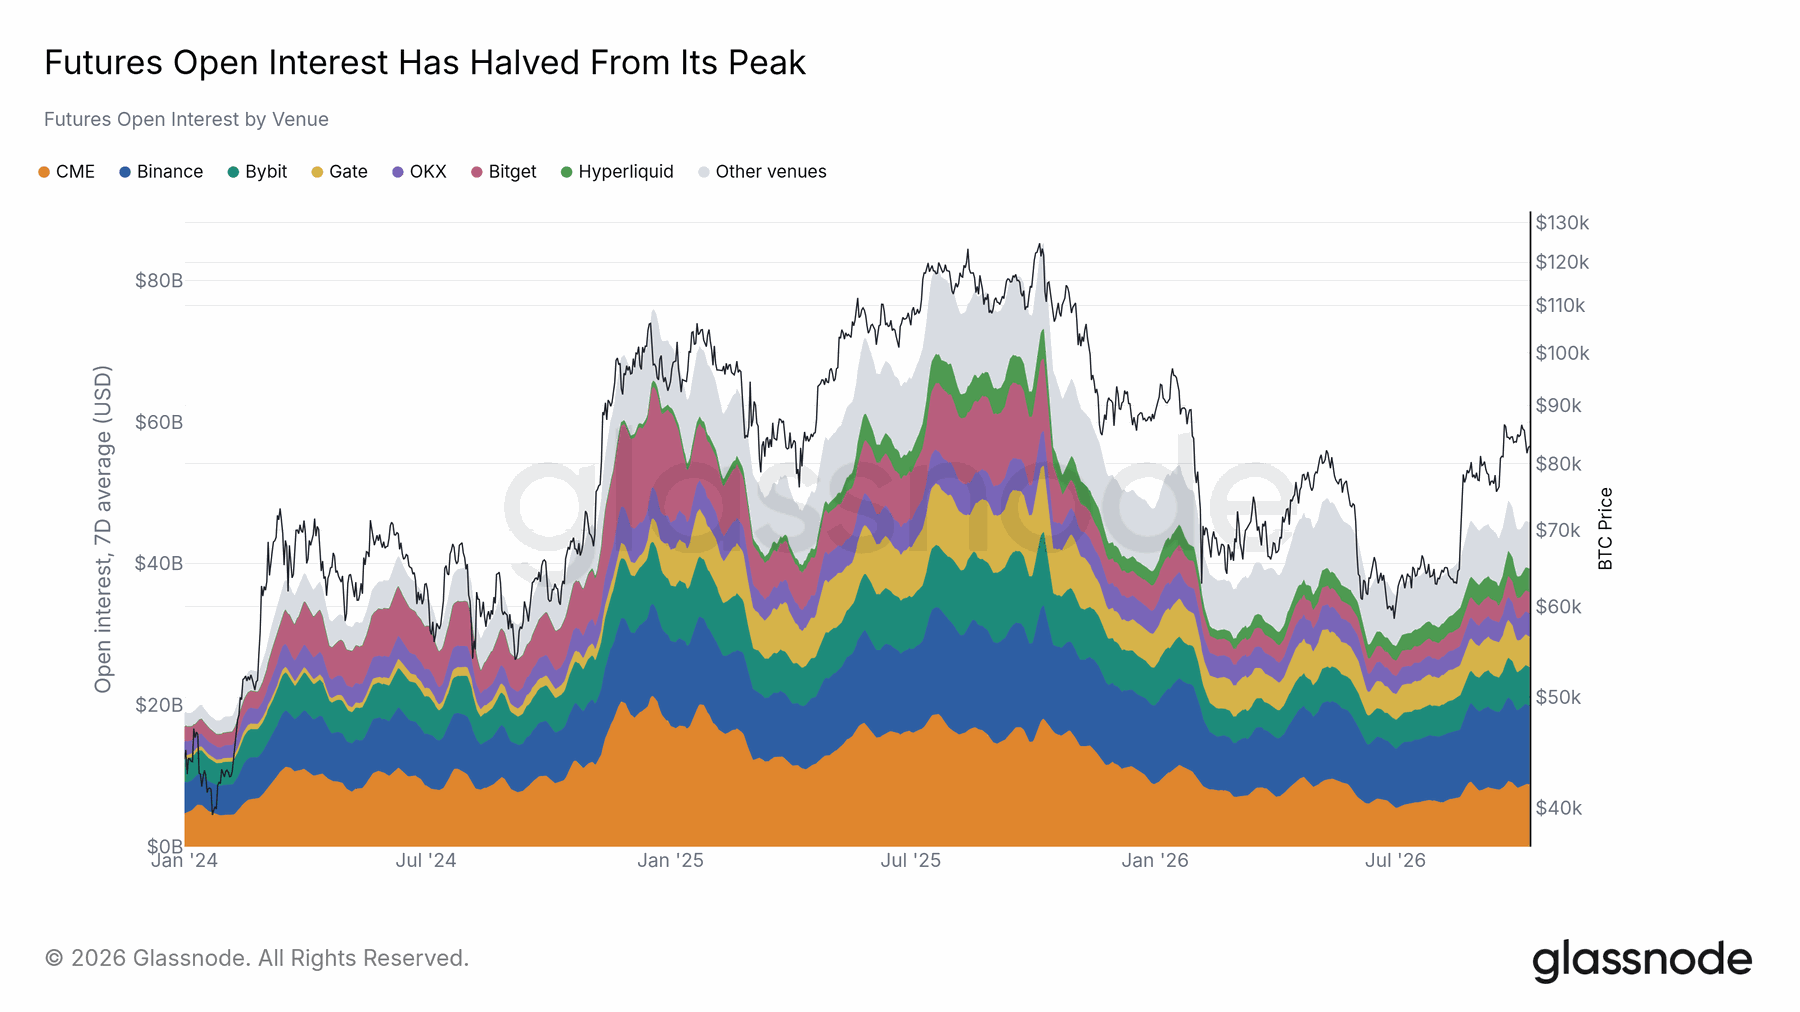
Across the tracked venues and CME, Bitcoin futures open interest fell from a peak of $85.3 billion to $45.7 billion. The contraction was smaller when measured in coins. This distinction matters because a fall in the dollar value of positions does not necessarily mean that the same proportion of contracts disappeared. CME’s share fell to 19%, from close to one third a year earlier, while Hyperliquid reached 7%.
The report links much of CME’s change to lower returns on basis trades paired with spot exposure. Venue share can therefore change because a strategy becomes less attractive, rather than because every participant abandons the market.
18 / Derivatives
Futures turnover returned to a quieter baseline
Trading activity remained far below the peak despite occasional bursts of forced execution.
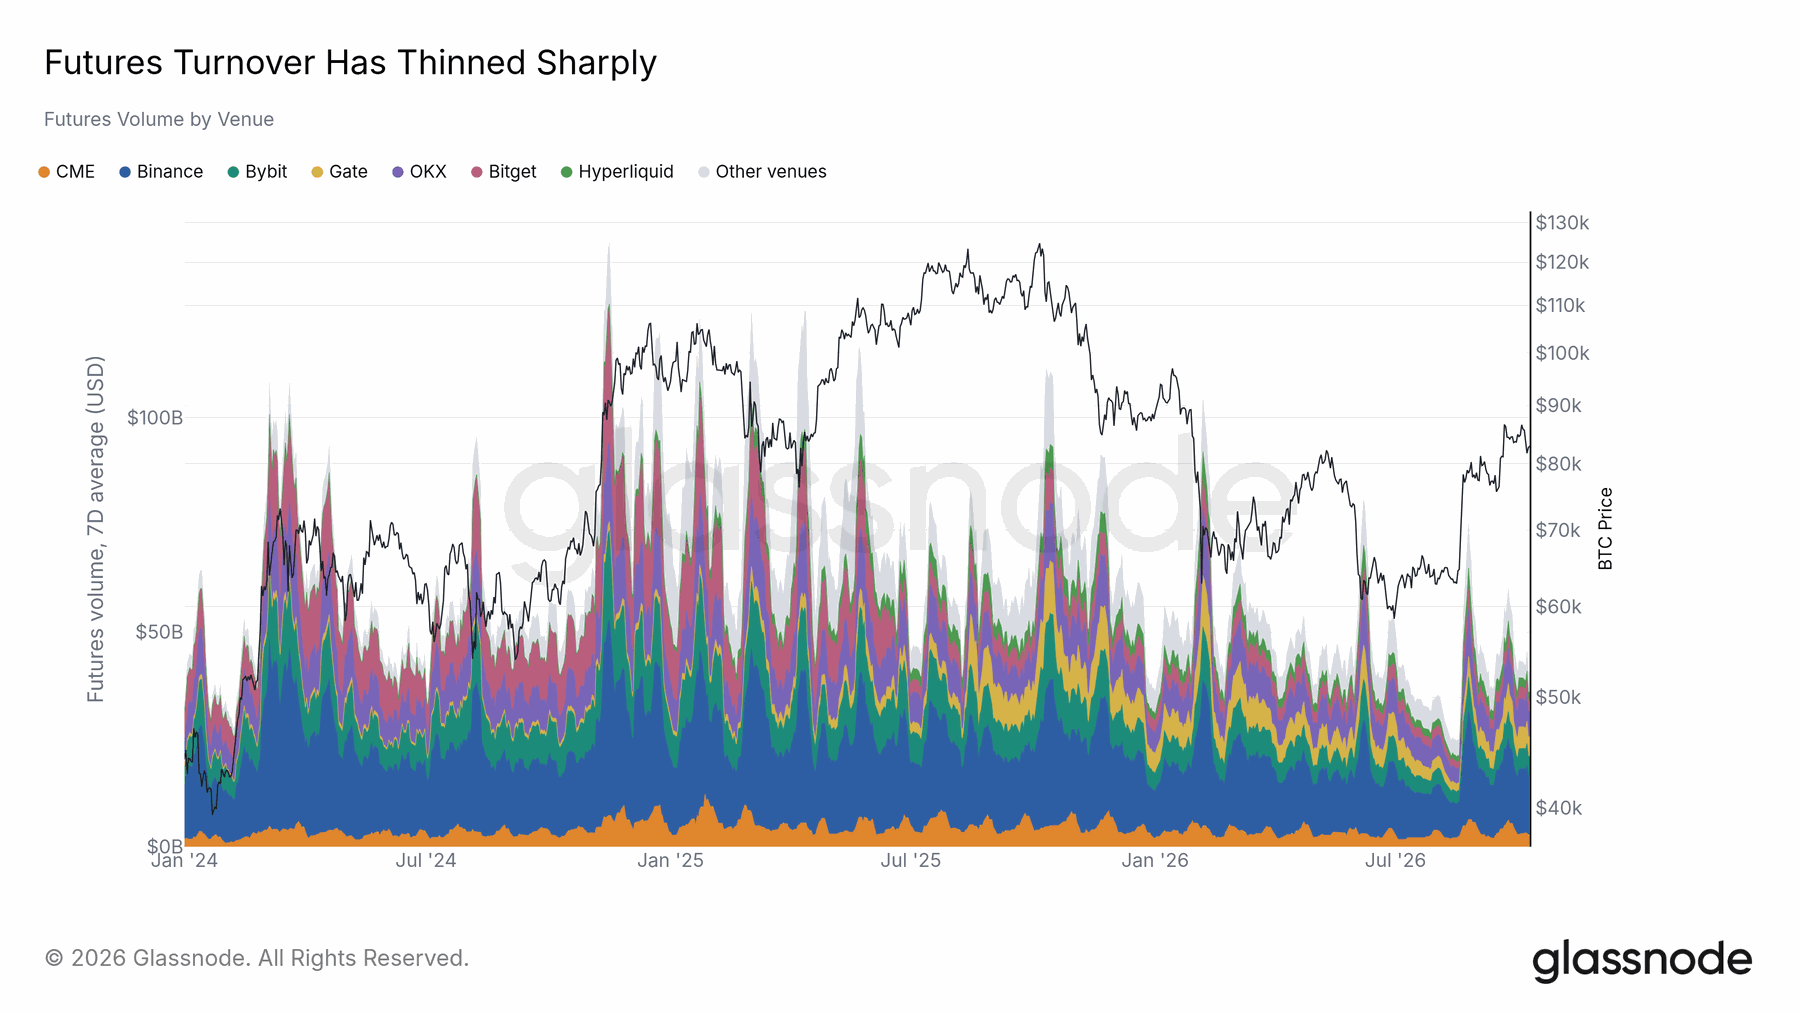
The seven-day average of daily Bitcoin futures volume was about $41 billion, less than one third of the November 2024 peak. The October 2025 liquidation cascade and August 2026 squeeze interrupted the quieter trend, but neither produced a lasting return to the earlier volume baseline. Perpetual swaps remained the main crypto-native trading instrument, with Binance carrying around one third of daily volume.
CME’s volume share was smaller than its open-interest share, consistent with positions being held for longer. Volume measures trading activity; open interest measures outstanding contracts. Their different behaviour should not be confused.
19 / Derivatives
On-chain venues gained a measurable share
Hyperliquid and Lighter together represented 7.5% of the report’s Bitcoin futures volume comparison.
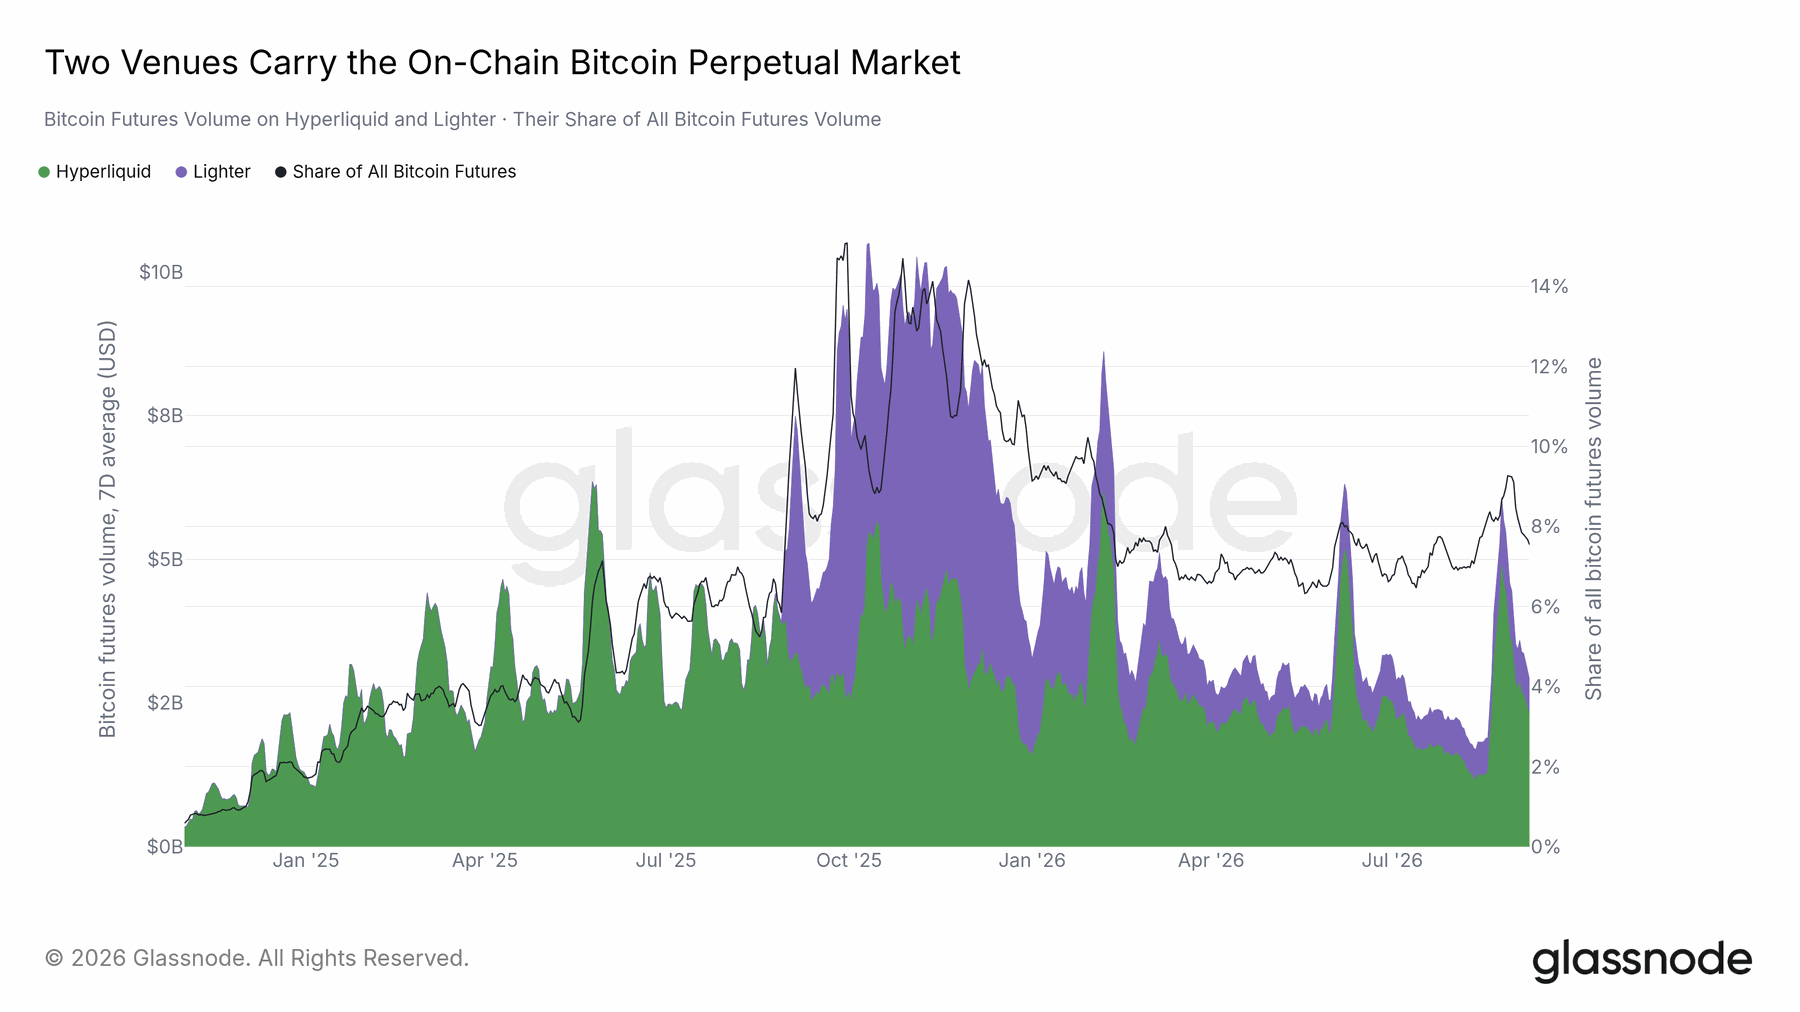
The two venues traded about $2.9 billion a day between them. Their combined share had risen from below 1% in late 2024, even as the broader measured market contracted. Hyperliquid supplied about four fifths of their combined volume after Lighter’s initial activity surge subsided. Coverage is important: Hyperliquid came from Glassnode’s feed, while Lighter was added using Fasanara data to both the numerator and denominator.
Newer venues were excluded. The report explicitly warns against comparing this Bitcoin-only, two-venue measure with the prior edition’s broader decentralized-perpetual estimate, which used a different dataset and denominator.
20 / Derivatives
The premium for staying long remained modest
Funding conditions cooled substantially from the cycle’s earlier crowded-long phase.
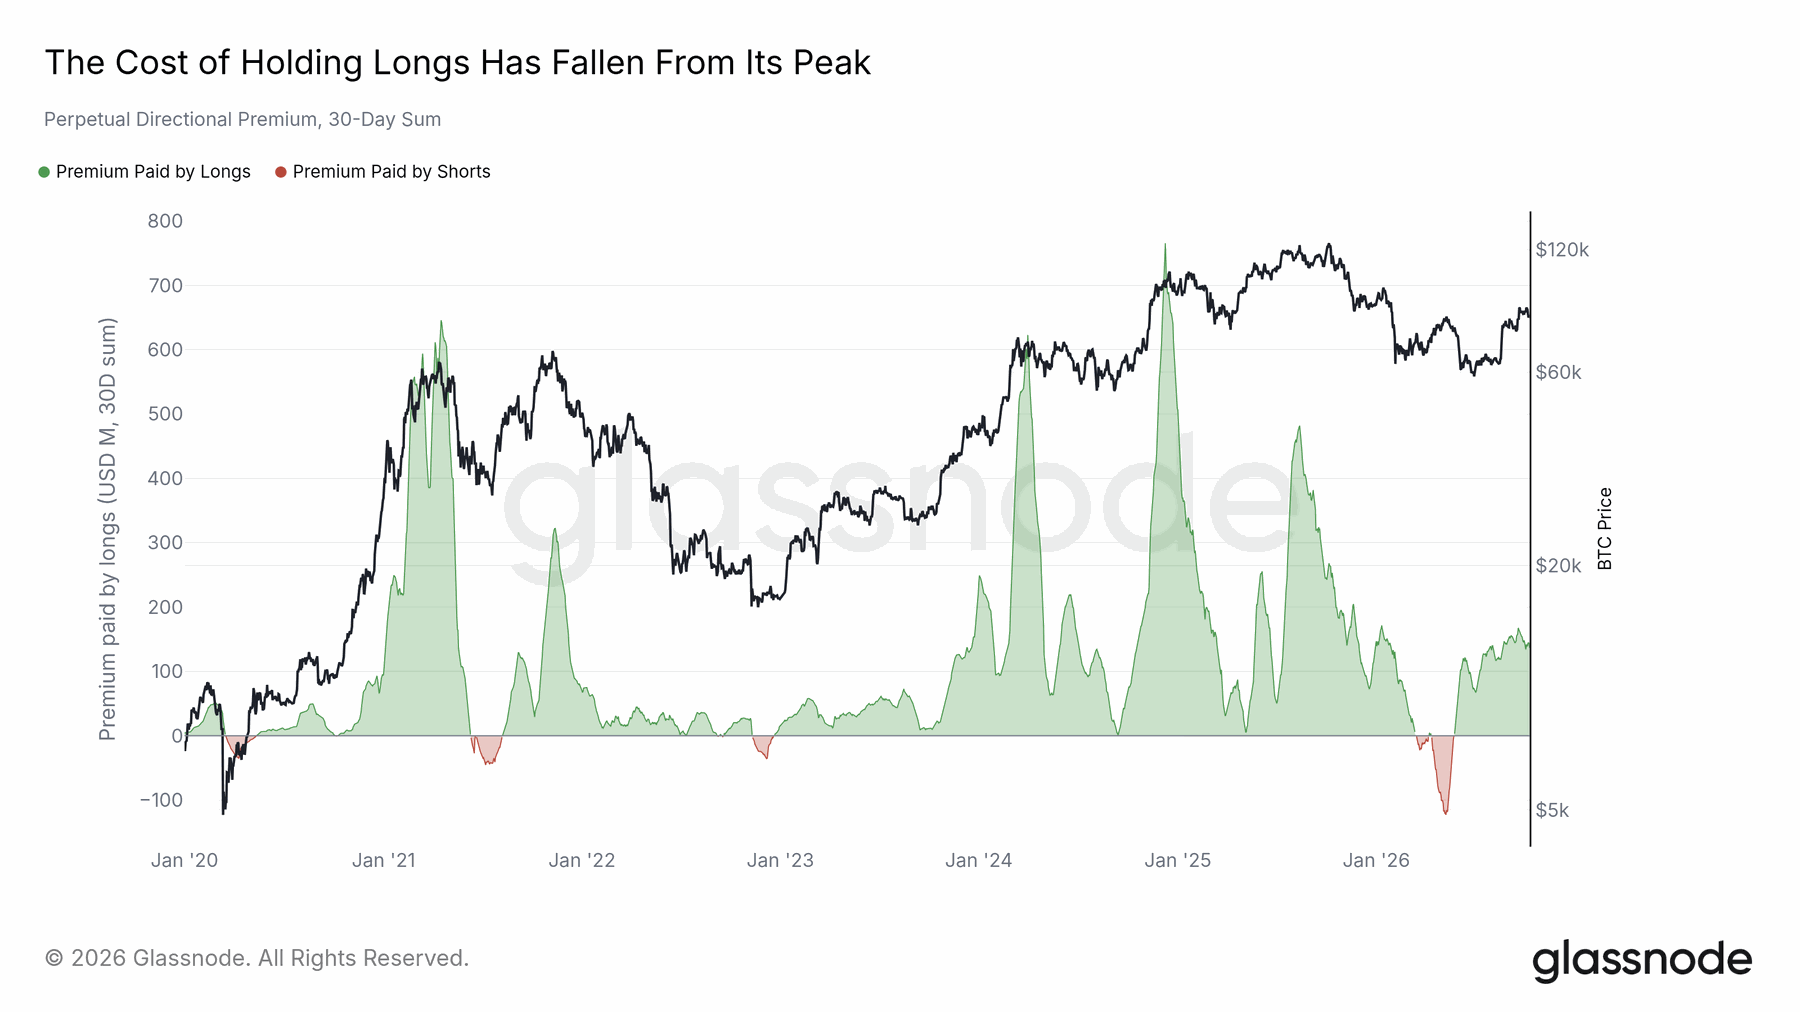
The report multiplies funding rates by perpetual open interest and sums the result over 30 days to estimate the dollar premium paid between the two sides of the market. That measure peaked at $766 million in December 2024 and was negative for 66 days between mid-March and late May 2026. At the negative extreme, shorts paid longs as much as $123 million over the monthly window.
The August rally then punished short positioning. Funding was positive again at the report date but well below earlier highs. Modest funding reduces one sign of crowding; it does not remove directional risk or guarantee room for further gains.
21 / Derivatives
Put liquidation totals in proportion
Normalizing forced closures by open interest makes different market episodes easier to compare.
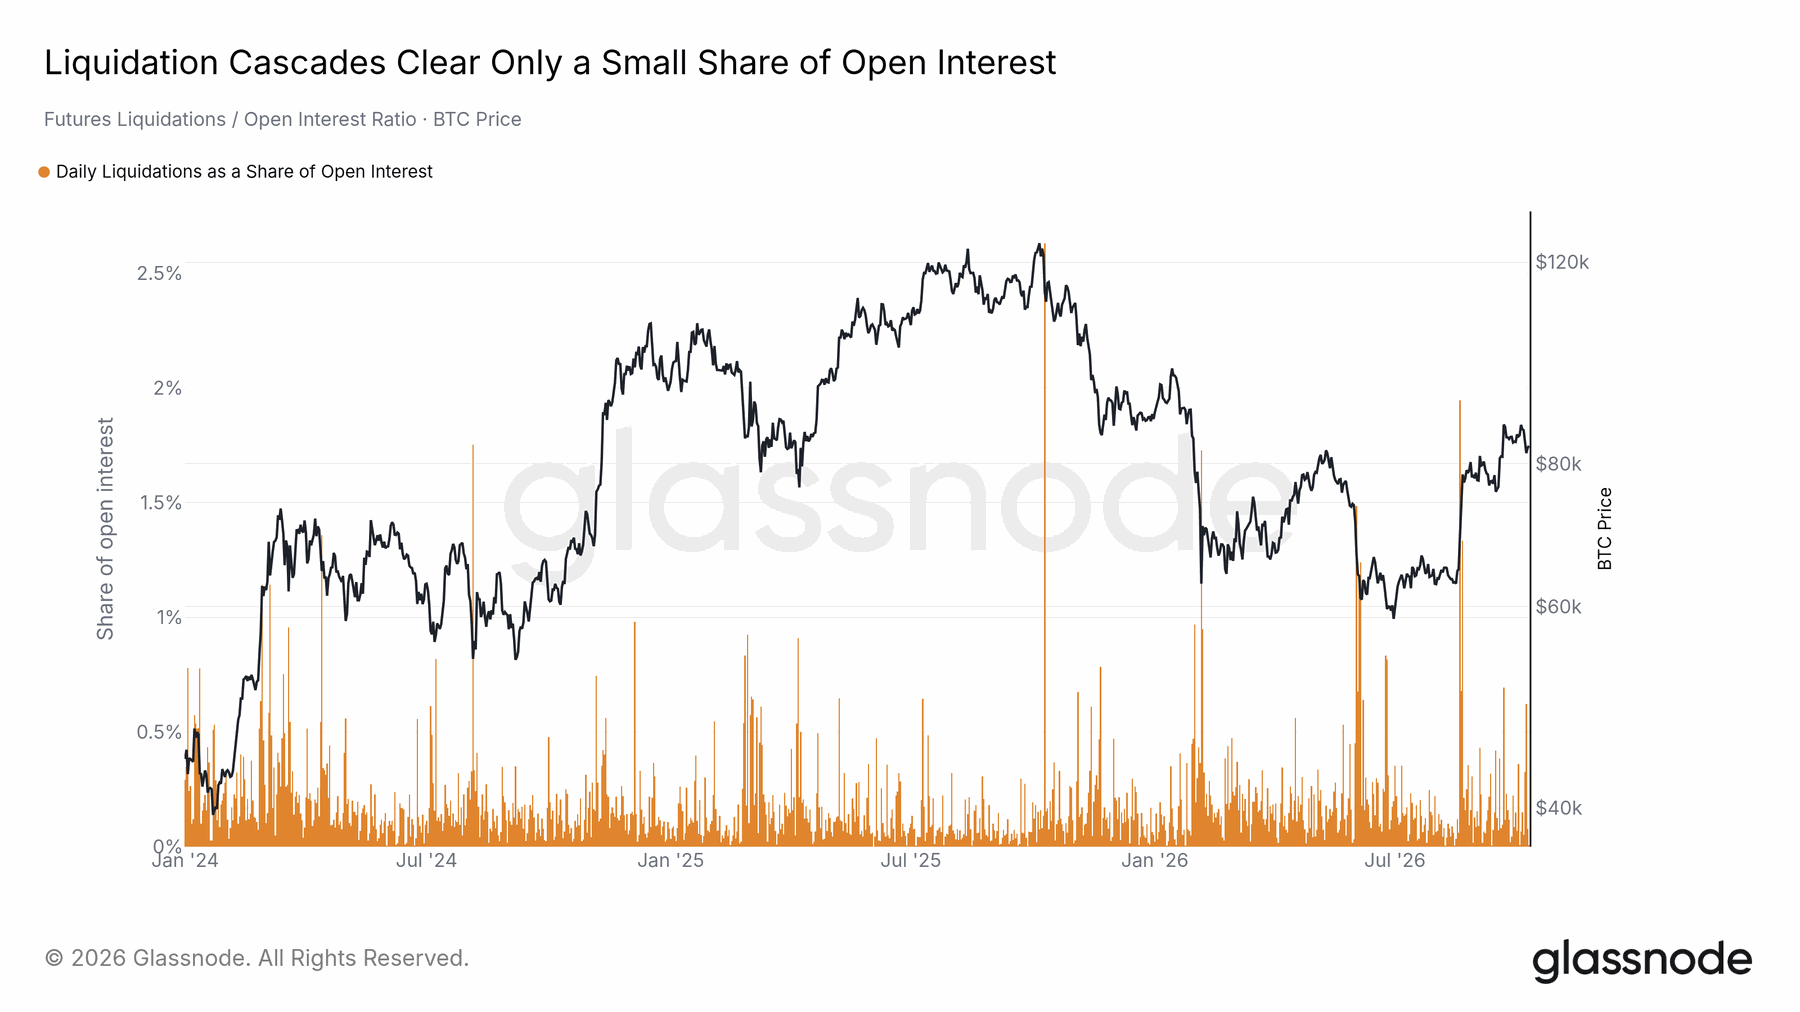
Dollar liquidation totals tend to grow with the market. The report instead compares each day’s liquidations with the open interest affected. The October 10, 2025 long liquidation event represented 2.6%, while the August 19, 2026 squeeze represented 2.0% from the other side of the market. Most sessions were far smaller, and only about one in ninety exceeded 1% in the reported sample.
Liquidations can amplify a move once positioning comes under pressure; a large total does not by itself explain its original cause. The series mainly covers centralized exchanges and does not fully include Hyperliquid.
22 / Derivatives
Options became a major part of the market
The report’s Bitcoin options book slightly exceeded the futures book in dollar open interest.
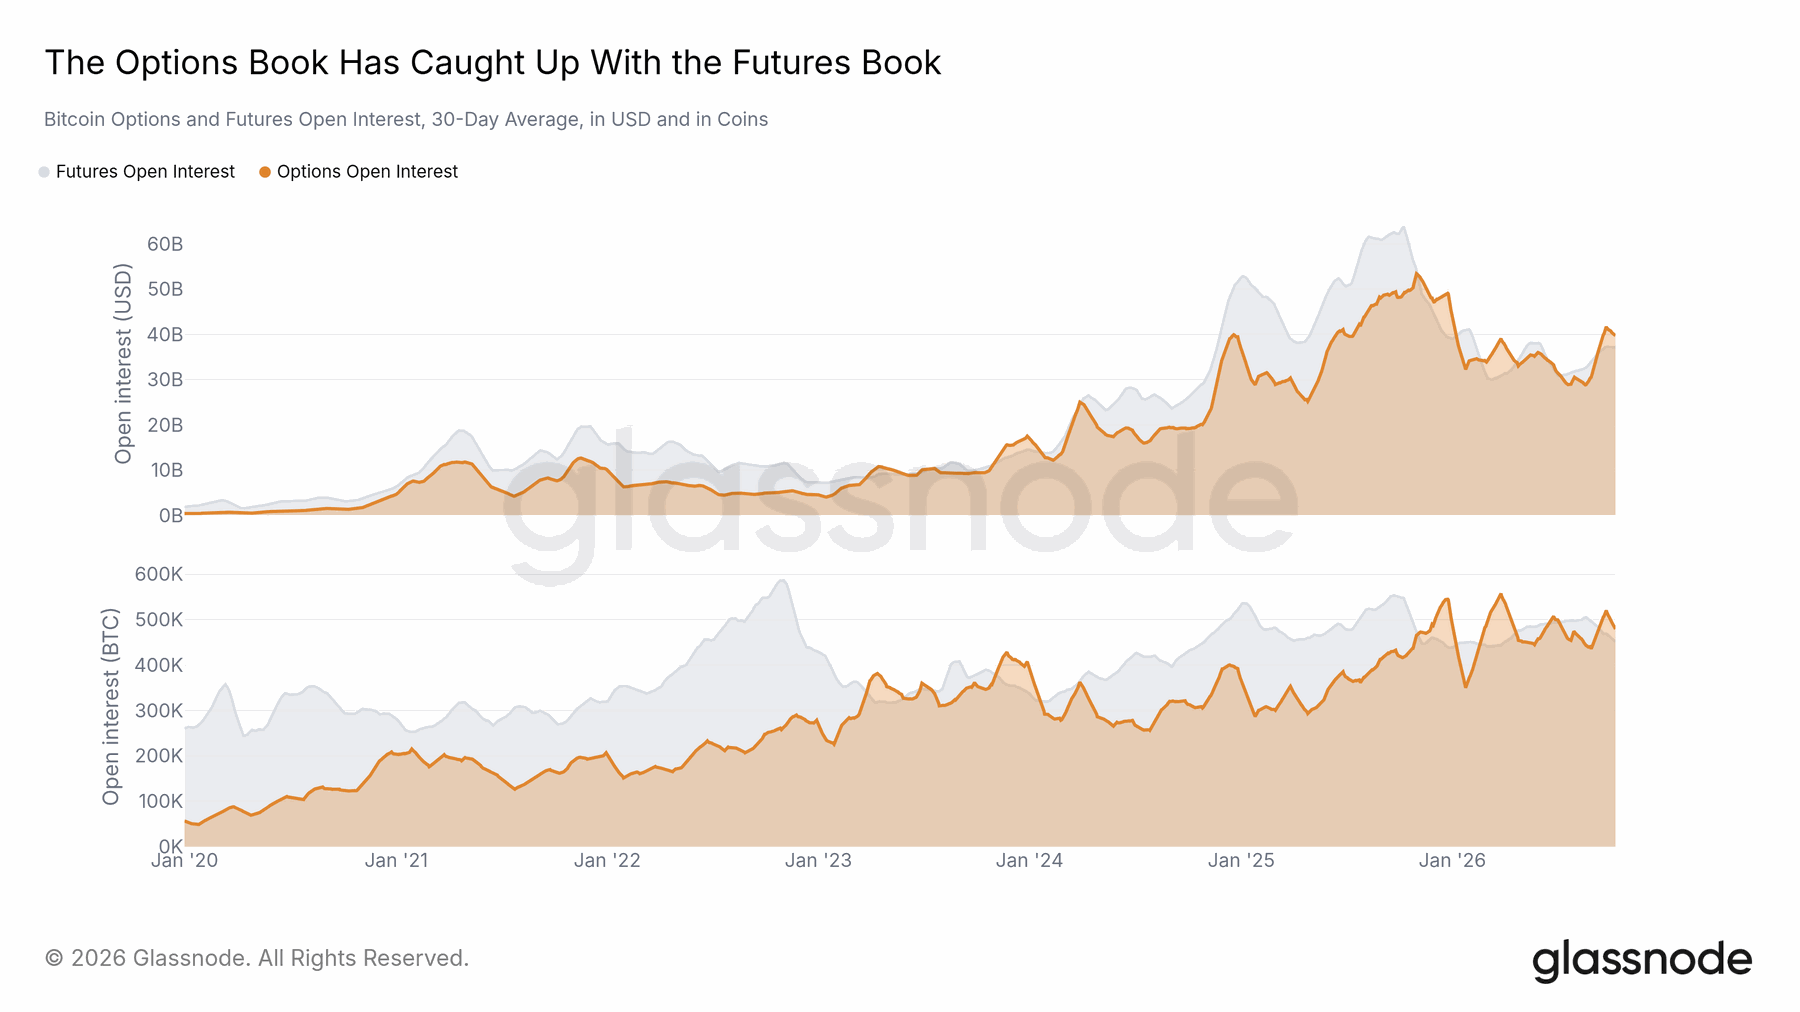
Options open interest had risen from about $8 billion five years earlier to $40 billion. The options-to-futures dollar ratio reached $1.07 per dollar of futures exposure. The catch-up also appeared in coin-denominated measures, so it was not merely a consequence of higher Bitcoin prices. Options open interest was 26% below its own dollar peak, compared with a 42% decline for futures.
The report associates this relative resilience with hedging demand. Open interest alone does not reveal the direction of every position, but a larger options market makes the price and distribution of risk increasingly important alongside futures leverage.
23 / Derivatives
The price of protection changed before the squeeze
Implied volatility measures what option buyers pay for uncertainty, rather than the volatility already realized.
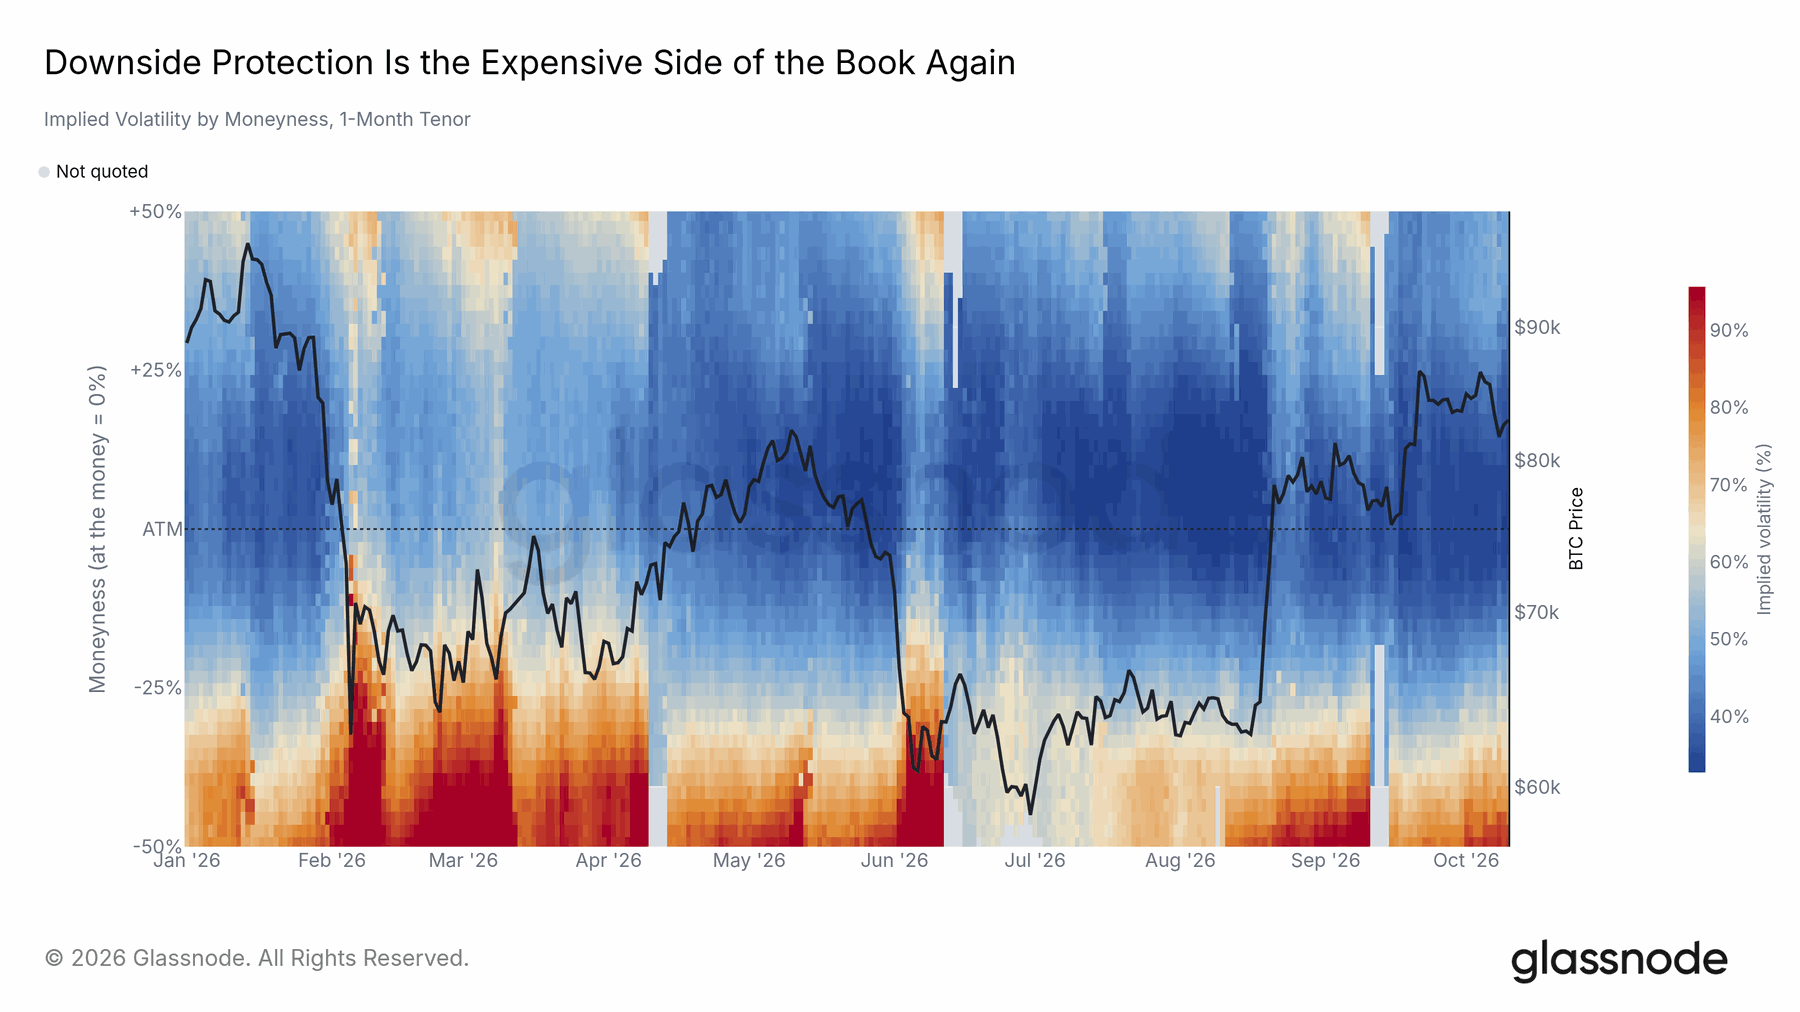
Downside puts were generally more expensive in implied-volatility terms than comparable upside calls during the drawdown. The gap peaked near 28 points in February. By July and August, implied volatility across strikes had fallen to its cheapest levels of the year, just before the sharp price move. Calls repriced during the rally, but the downside premium later reopened to 14.7 points.
Cheap options did not cause the squeeze. Hedging flows can affect its transmission, depending on positioning, but the chart alone cannot establish every dealer’s exposure. The renewed put premium indicates that demand for downside protection had not disappeared.
24 / Traditional assets on crypto rails
Crypto trading was still smaller than the US equity tape
The comparison is a scale reference with explicit coverage limits.
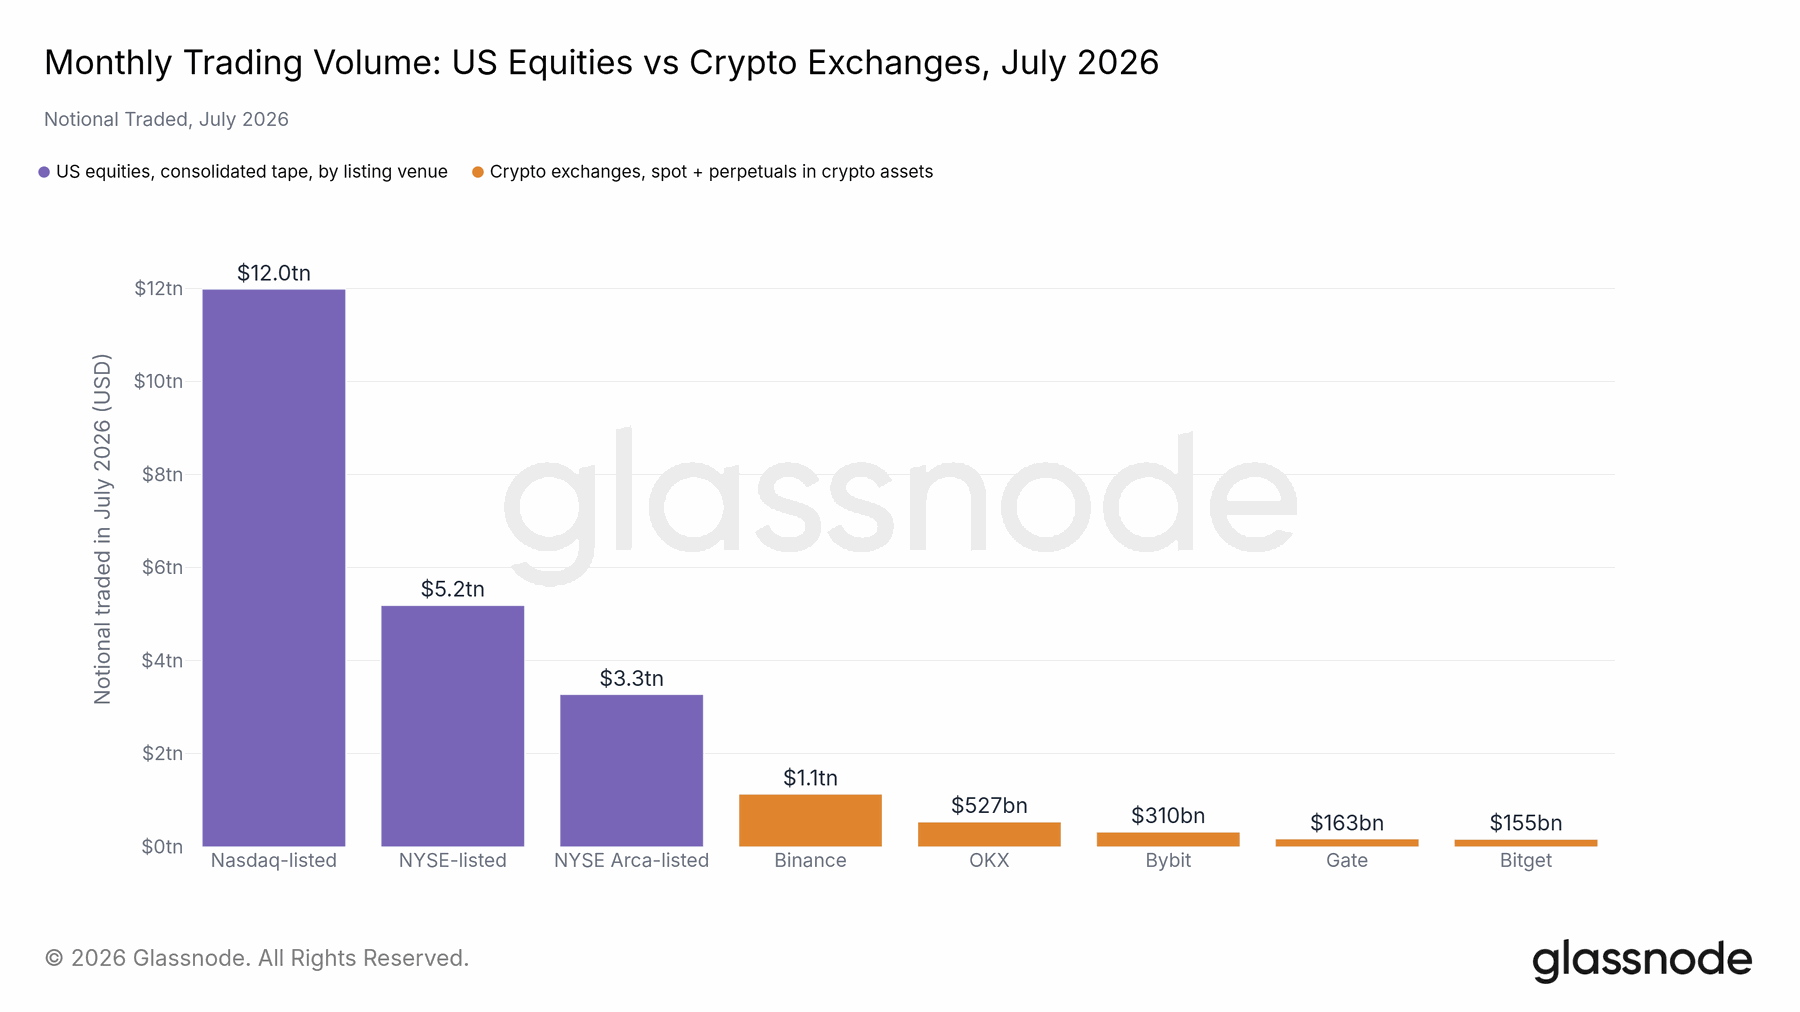
For July 2026, the five tracked crypto exchanges recorded $2.28 trillion of spot and perpetual activity in crypto assets, against $20.5 trillion on the US equity consolidated tape. The roughly 11% monthly comparison should not be mistaken for a claim about the share of all global financial trading. Crypto traded every day, while the equity sample covered 22 sessions.
Daily averages were $73.5 billion and $933 billion respectively. Coinbase, Kraken, Upbit, Hyperliquid and decentralized venues were outside the five-exchange crypto sample, as were traditional-asset perpetuals. The result is a defined partial comparison, not an exhaustive market total.
25 / Traditional assets on crypto rails
Traditional-asset perpetuals expanded rapidly
Contracts referencing stocks, ETFs, indices, gold and oil became a substantial part of tracked perpetual activity.
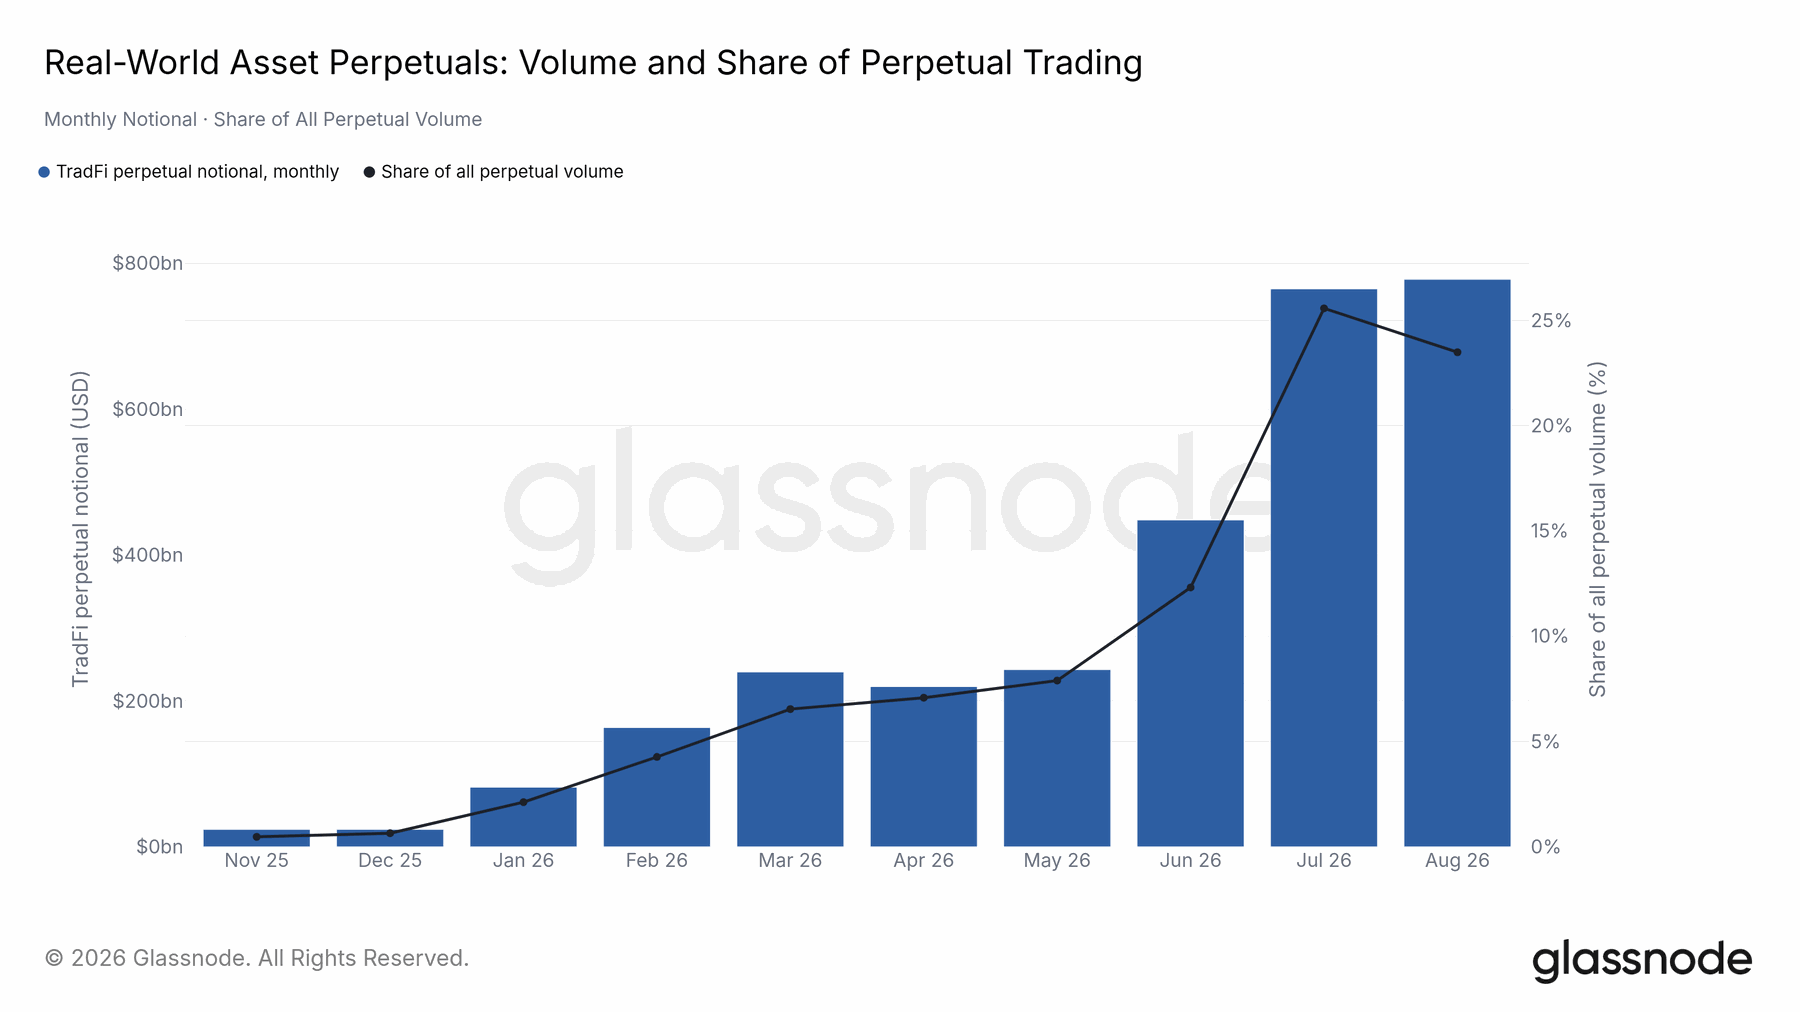
Monthly notional in the six venue groups rose from $23.5 billion in November 2025 to $778 billion in August 2026, about 33 times larger. Its share of tracked perpetual volume rose from 0.5% to 23.5%, with a July peak of 25.6%. Part of the share increase came from a 49% decline in crypto-asset volume, but the report’s decomposition attributes most of it to genuine growth in traditional-asset contracts.
Notional turnover is not invested capital. These contracts are also not equivalent to owning the underlying shares, and comparisons with equity-market turnover should be treated as size comparisons.
26 / Traditional assets on crypto rails
Distribution mattered more than listing first
Binance became the largest venue in the report’s traditional-asset perpetual comparison after entering later.
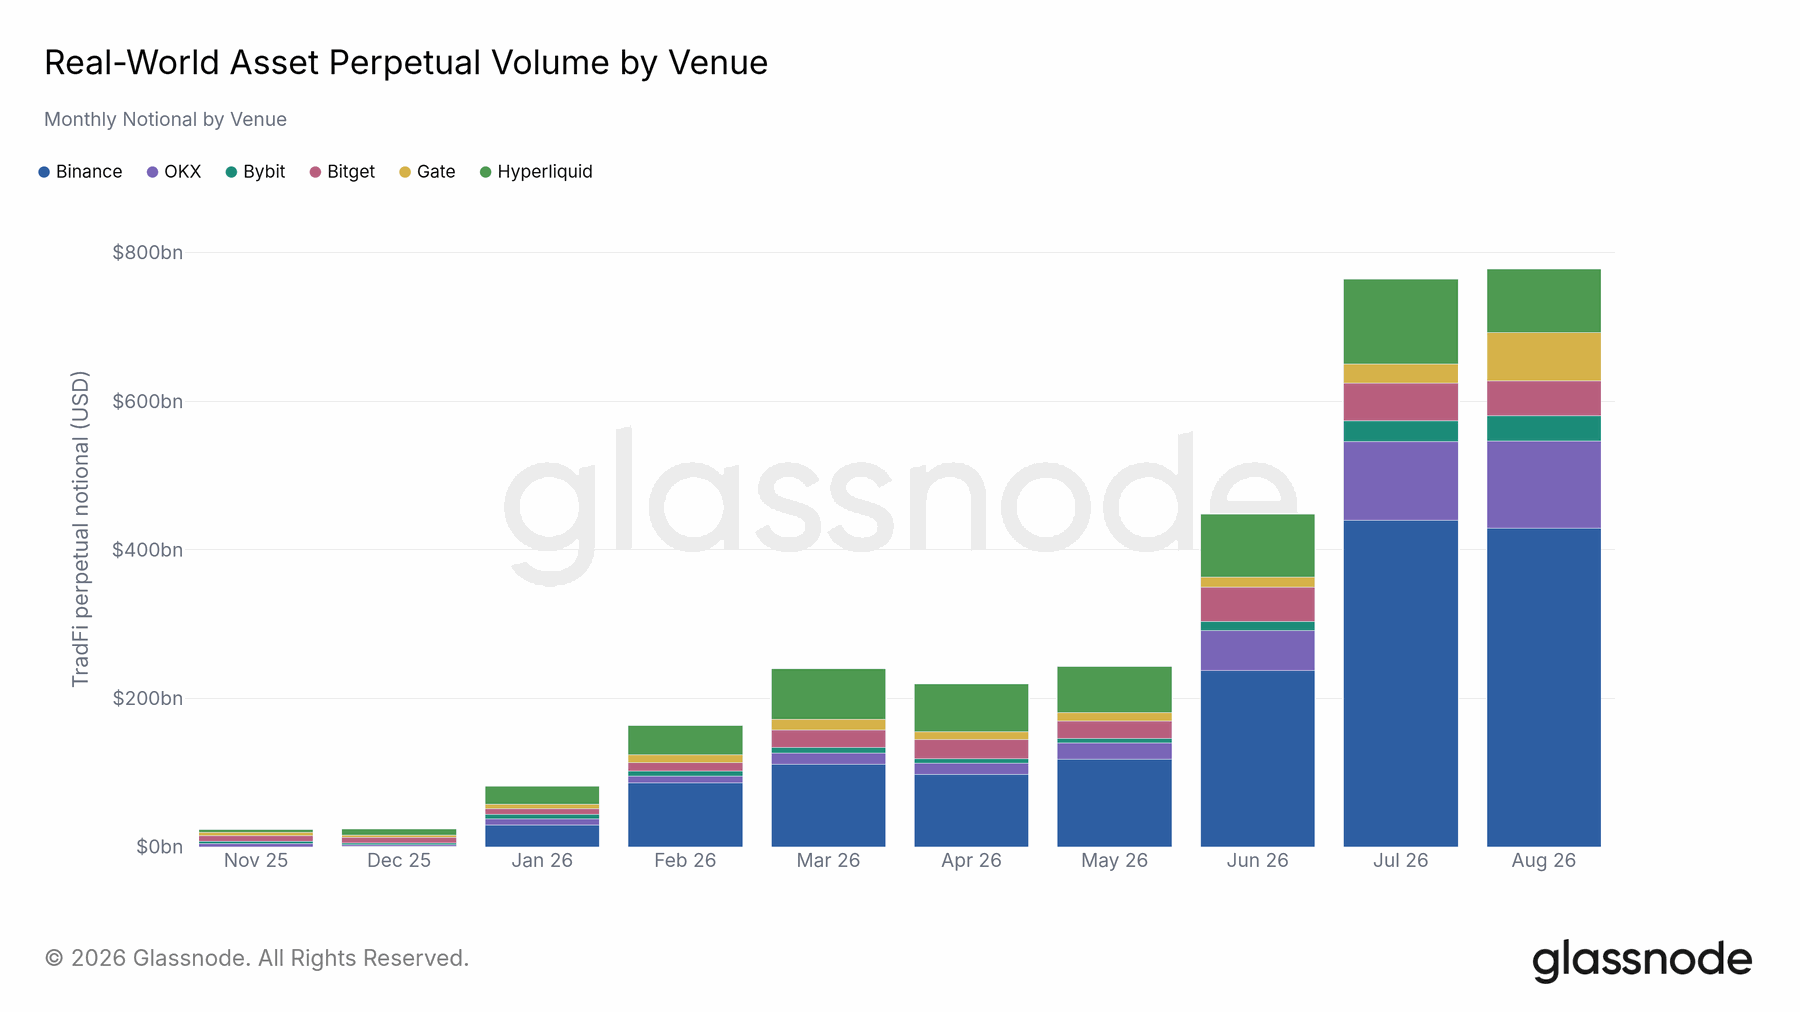
Binance had no recorded share in November 2025 but carried $429 billion, or 55.2%, by August 2026. OKX followed at 15.1% and Hyperliquid at 11.0%. Every tracked venue grew; the largest existing crypto trading venue gained the most absolute volume. The product mix differed within each venue. Traditional assets represented 35.2% of Hyperliquid perpetual volume, 27.6% on Binance and 9.5% on Bybit in August.
Memory-chip stocks, semiconductor and Korea ETFs, precious metals and oil featured prominently. Listing counts alone therefore reveal less than the combination of distribution, product demand and execution quality.
27 / Traditional assets on crypto rails
New markets gained ground on Hyperliquid
The report compares trade.xyz traditional-asset contracts with Hyperliquid’s own Bitcoin perpetual activity.
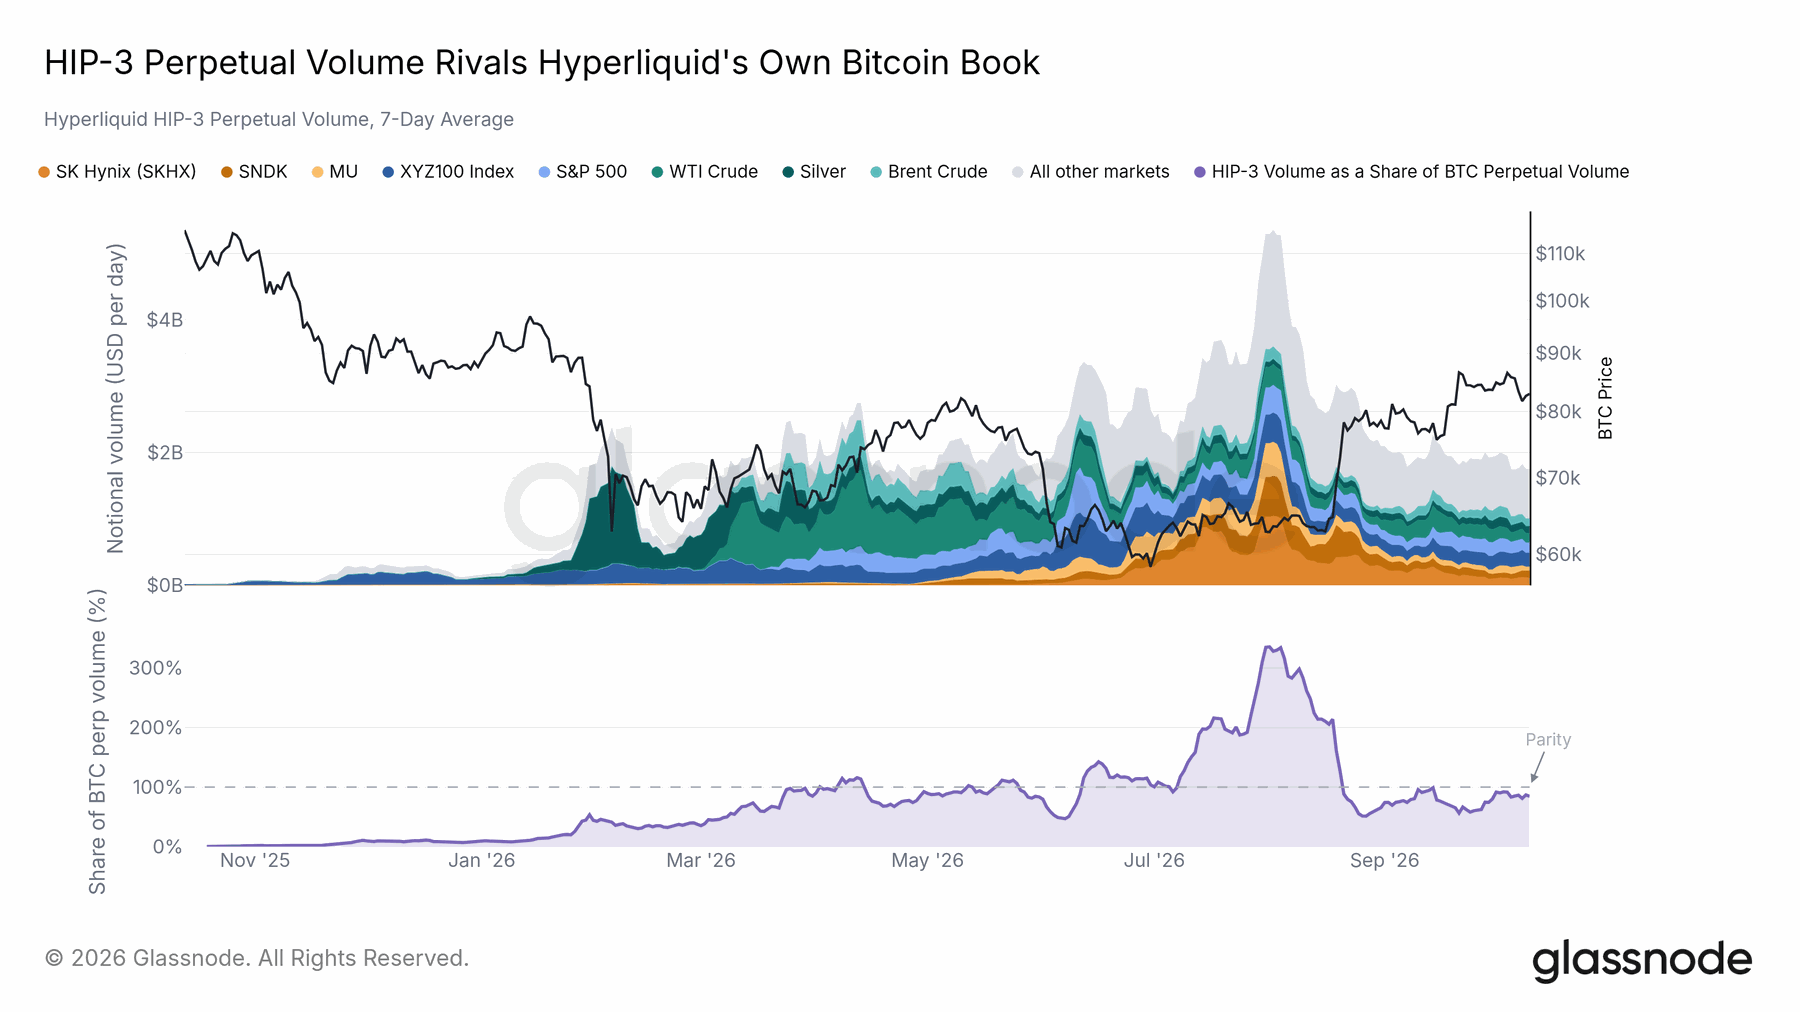
Hyperliquid’s HIP-3 framework supported markets referencing assets beyond crypto. The report shows the trade.xyz book growing from less than one tenth of the venue’s Bitcoin perpetual volume at the start of the year to around 85% at its latest reading. The ratio exceeded parity on 84 days and peaked above three times the Bitcoin book on August 1.
That is a venue-specific comparison using its public API, not a share of all Bitcoin trading. Whether the new markets retain their relative activity when Bitcoin volumes strengthen is a more demanding test of lasting adoption.
28 / The August squeeze
The August rally stood apart from equities
The report describes the cross-asset reaction while leaving the exact causal attribution open.
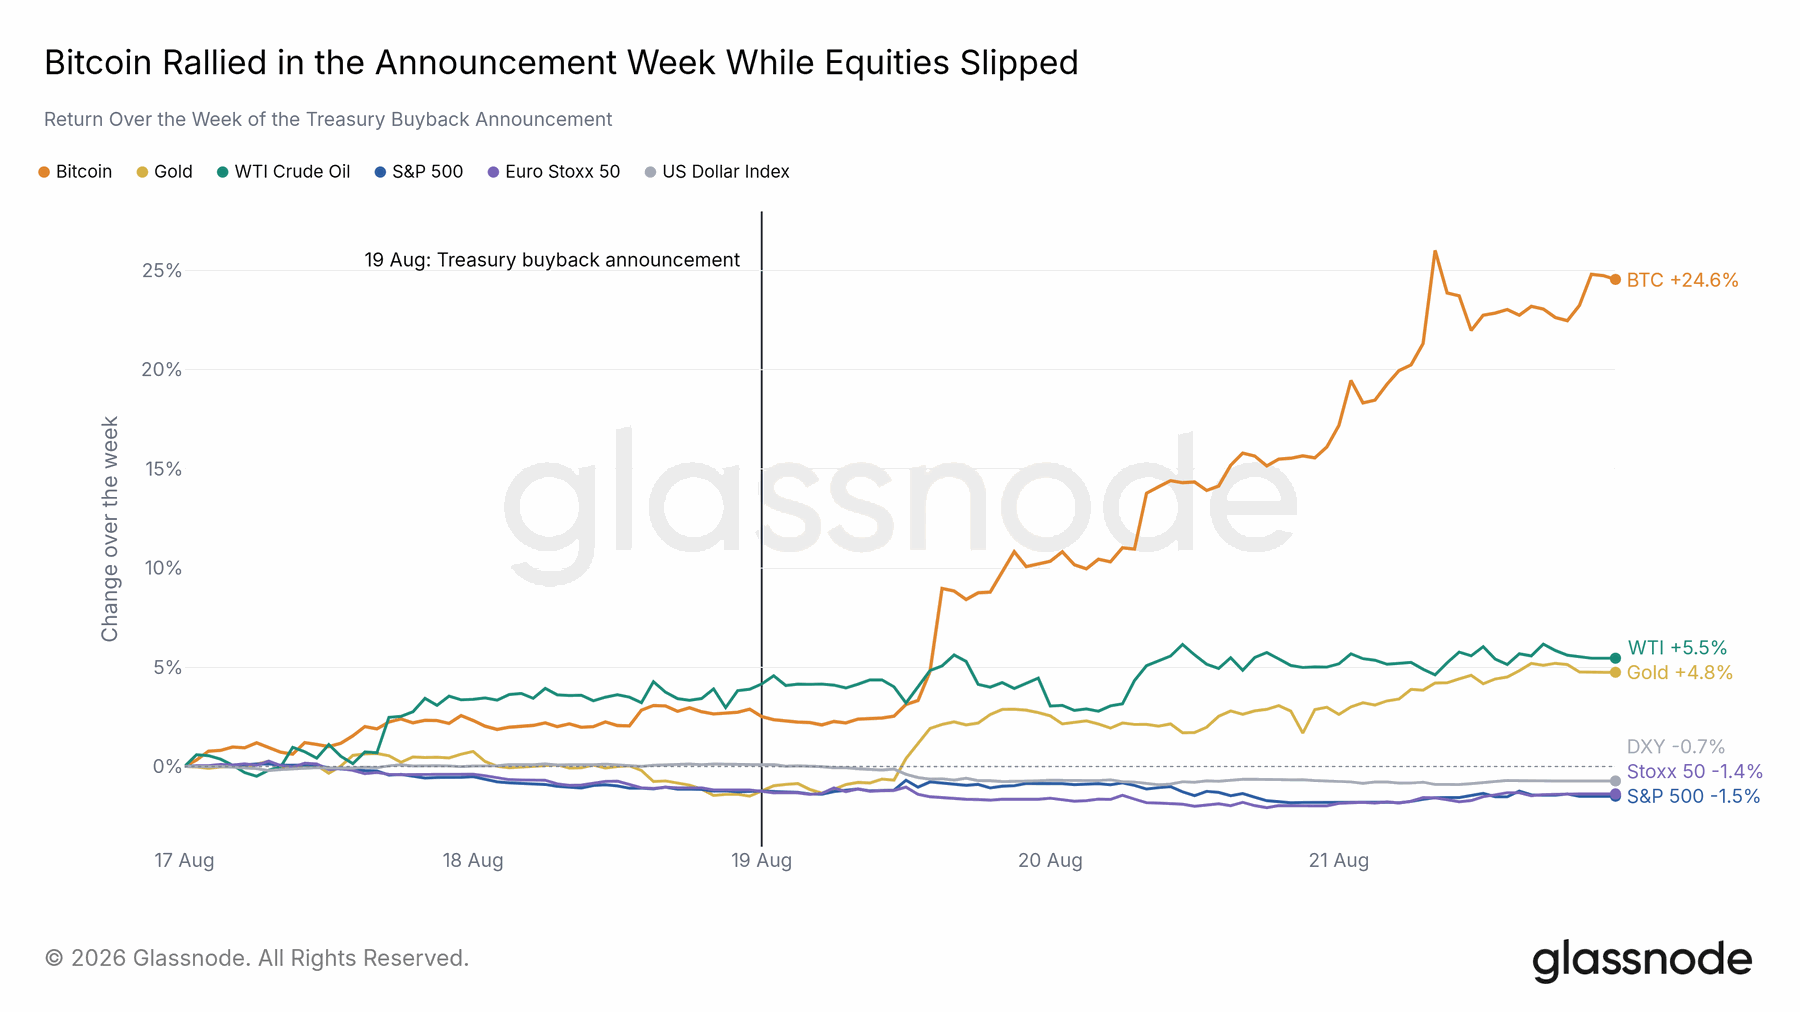
The Treasury buyback announcement and a White House push on crypto legislation occurred on August 19. Bitcoin rose about 6% that day and 25% over the week. Gold also rose, the dollar weakened and equities did not share the same strength. The important observation is the separation between hard-asset performance and equities during that window.
Several events and positioning changes occurred together, so their timing does not prove that one announcement caused the entire move. The report connects the episode to the subsequent strengthening in Bitcoin’s gold correlation.
29 / The August squeeze
The liquidation map explains the amplification
Modelled short-exposure bands shrank sharply as price moved through them.
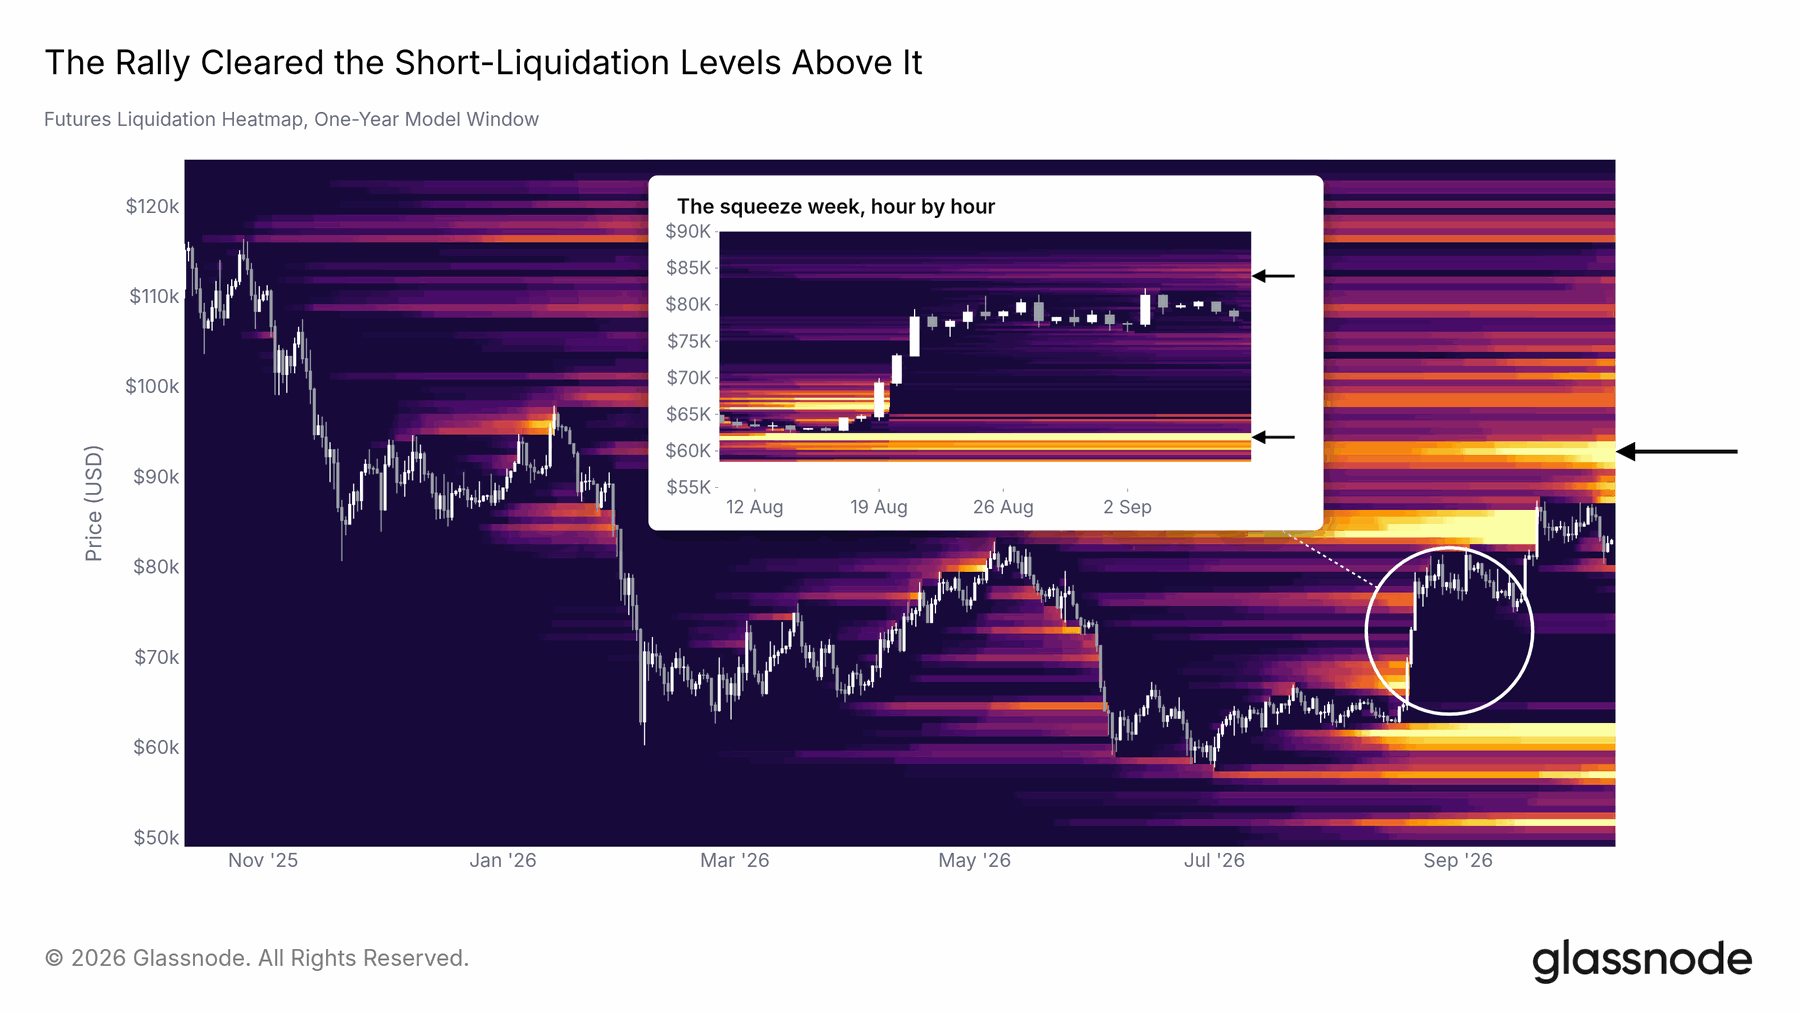
In the report’s model, the $65,000–70,000 band fell from $7.0 billion of exposure to $344 million within two days. The $73,000–78,000 band subsequently fell from $4.7 billion to $307 million. These estimates describe potential liquidation exposure, not live resting buy or sell orders. A later $82,000–86,000 band was also largely cleared.
At the report date, the largest modelled cluster was between $87,000 and $95,000, at $13.4 billion. Such clusters can help explain why a move accelerates, but they are not guaranteed price targets and change as traders alter positions and collateral.
30 / Adoption
Stablecoin supply held through the drawdown
The stock of on-chain dollars was resilient even though its rapid expansion had paused.
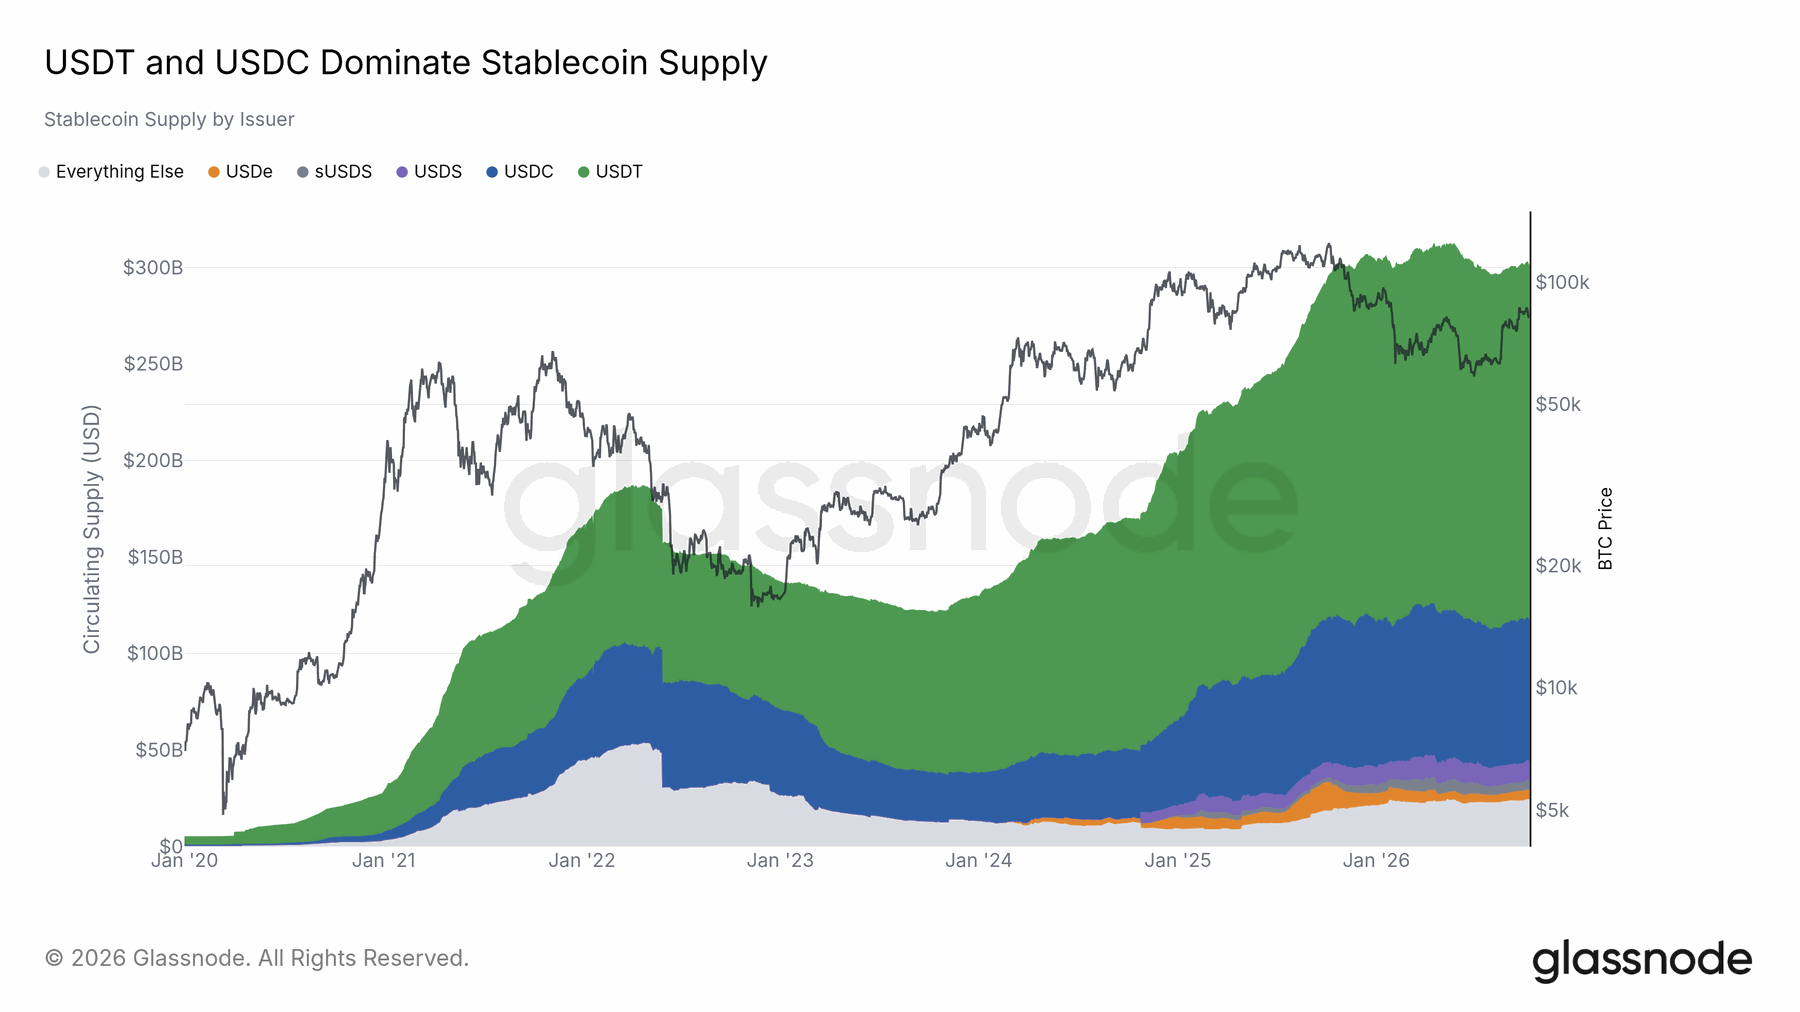
The report puts total stablecoin supply near $301 billion, only about 7% above a year earlier and broadly range-bound since October 2025. USDT accounted for roughly 61% and USDC about one quarter. The volatile-asset downturn was therefore not accompanied by a comparable contraction in stablecoin supply. Stable supply is consistent with dollars remaining on crypto rails rather than being fully redeemed into fiat.
It does not reveal every holder’s intentions or guarantee that those balances will be used to buy Bitcoin. Both leading issuers’ reserve exposure to short-dated Treasuries also connects on-chain dollar activity to the wider interest-rate environment.
31 / Adoption
Stablecoin settlement kept expanding
The same supply base supported more transfers, with different roles for the two largest issuers.
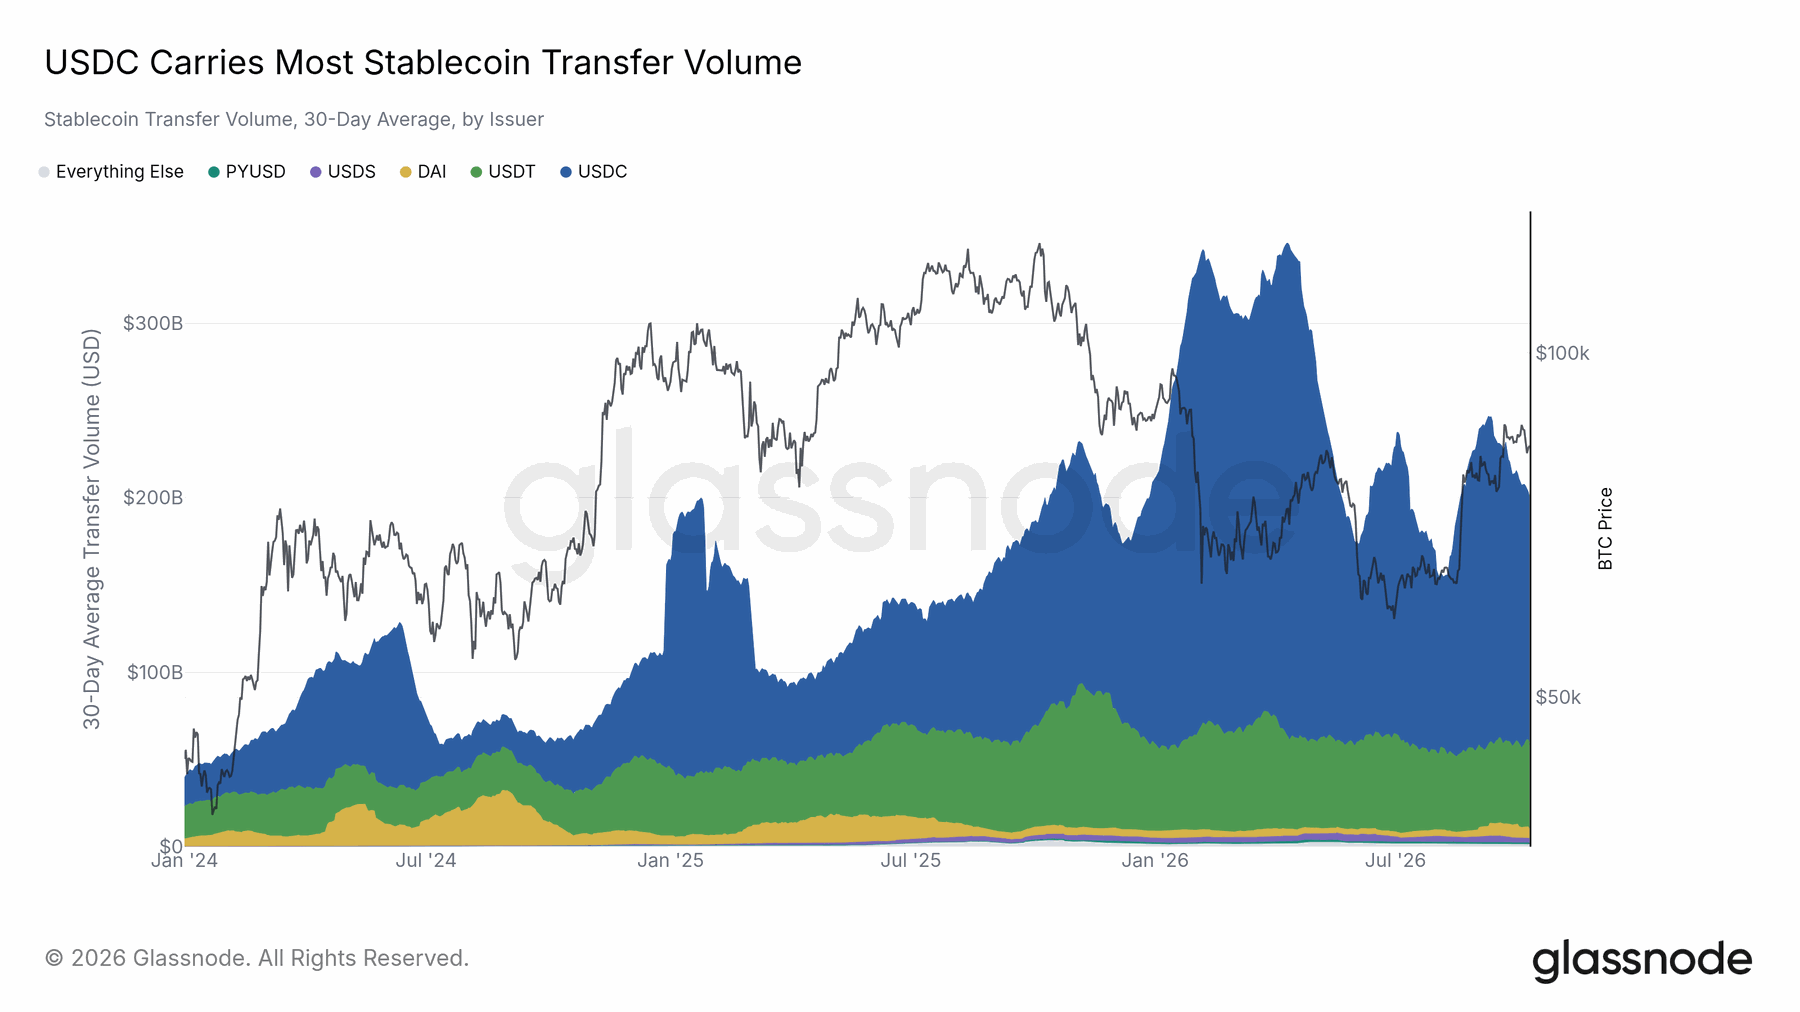
Across the eight tracked coins, the report records around $200 billion of daily transfer volume on a 30-day-average basis, 22% above a year earlier. USDC carried about 70% of that volume despite representing around one quarter of supply; USDT carried about one quarter of transfers while holding most of the supply. The comparison highlights different patterns of holding and movement across the two networks of users.
Transfer volume should not be read as a count of unique purchases or newly invested dollars: the same balance can move repeatedly. The stronger activity nevertheless shows that on-chain settlement remained useful during a period of weaker crypto prices.
32 / Adoption
Tokenized equities became a broader product category
More holders and a second sizeable issuer pointed to expansion beyond a single distribution channel.
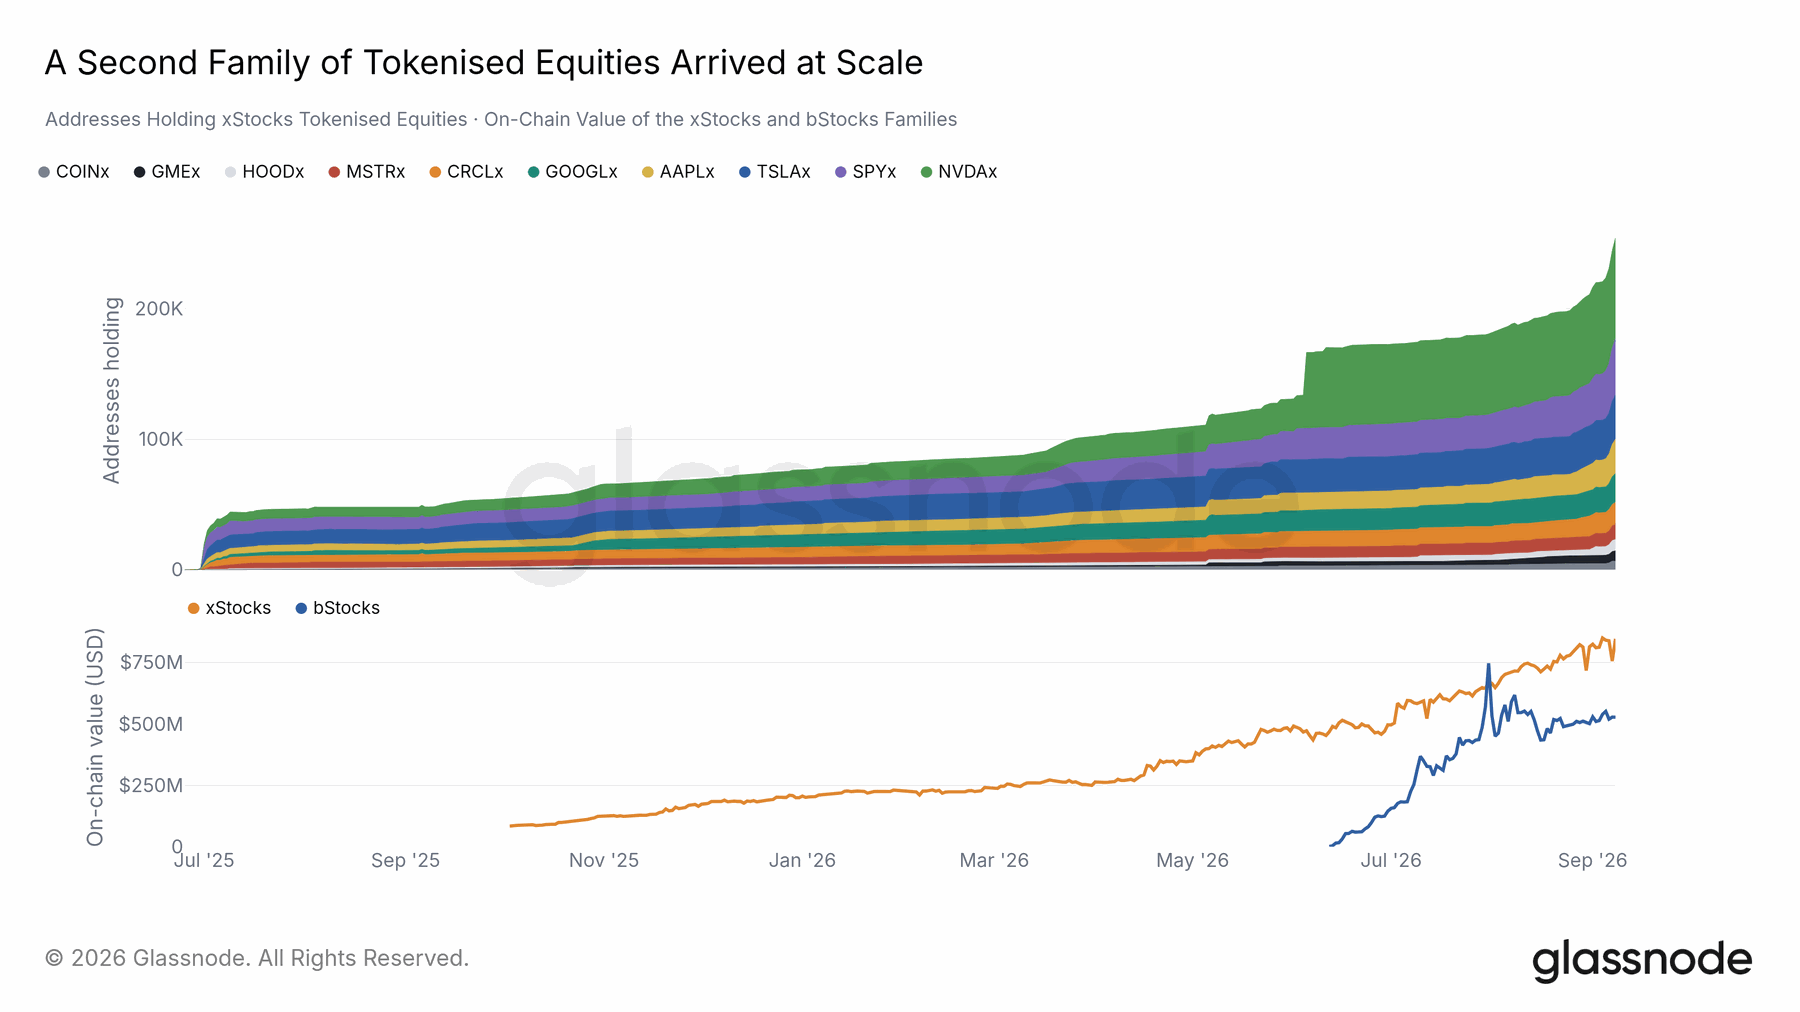
The report’s ten-token xStocks sample reached 254,000 holding addresses, around five times the prior-year count. Separately, it values the full xStocks family at $847 million and bStocks at $528 million by September, for a combined $1.37 billion. Those panels have different coverage: address counts for ten tracked tokens above, whole-family on-chain values below.
Addresses are not the same as unique investors. The report’s roughly $1,500 average position in its tracked xStocks sample suggests the category remained small at the individual holding level, despite rapid growth in the overall product set.
33 / Institutional allocators
The buying mix shifted toward corporate balance sheets
Large identifiable holder groups retained substantial Bitcoin holdings through the decline.
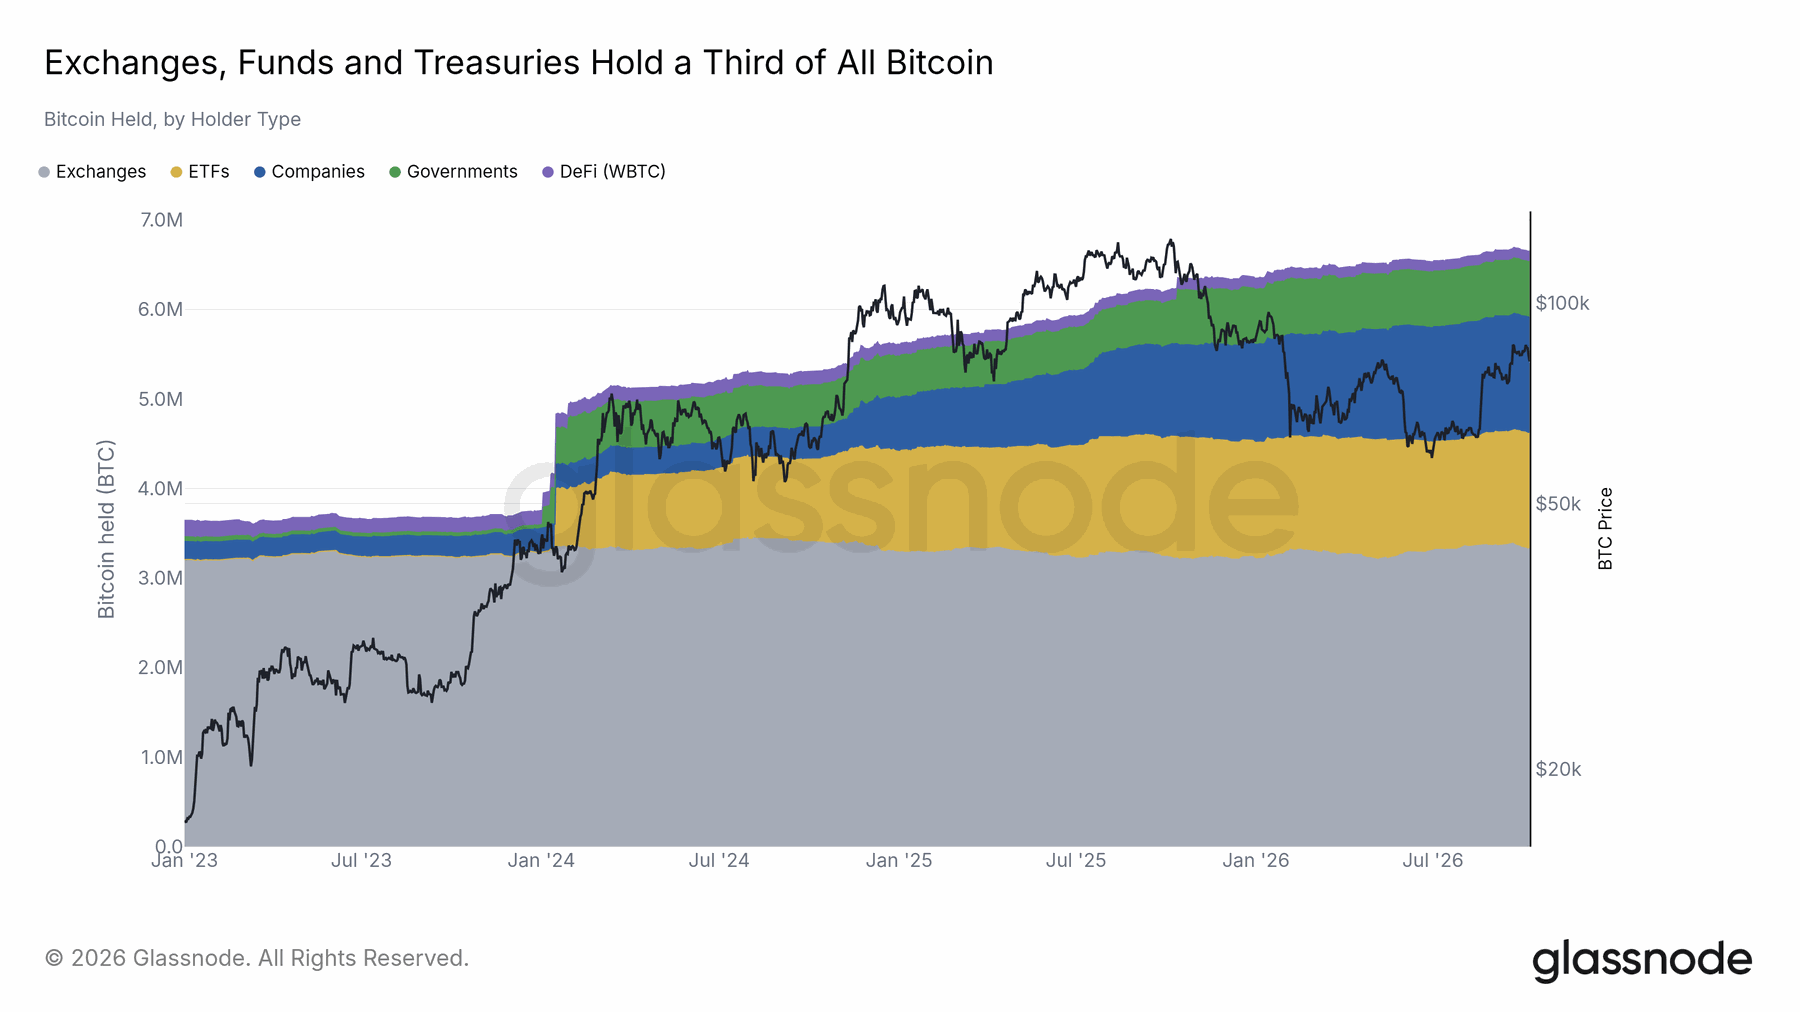
The report’s five holder categories controlled around 6.7 million BTC, roughly one third of circulating supply. Exchanges accounted for about half of this total, and corporate treasury holdings had overtaken spot ETFs. The ETF coin balance was only 6% below its October 2025 peak despite a much larger price drawdown. Corporate treasuries added 268,000 BTC over the prior twelve months in this dataset, while funds were net sellers over that interval.
Coverage matters: the company category combines public and private holders, and the DeFi category includes wrapped Bitcoin only. Category totals describe custody and reported holdings, rather than proving a single common investment motive.
34 / Institutional allocators
ETF demand reopened after heavy redemptions
The sequence of inflows mattered as much as the monthly total.
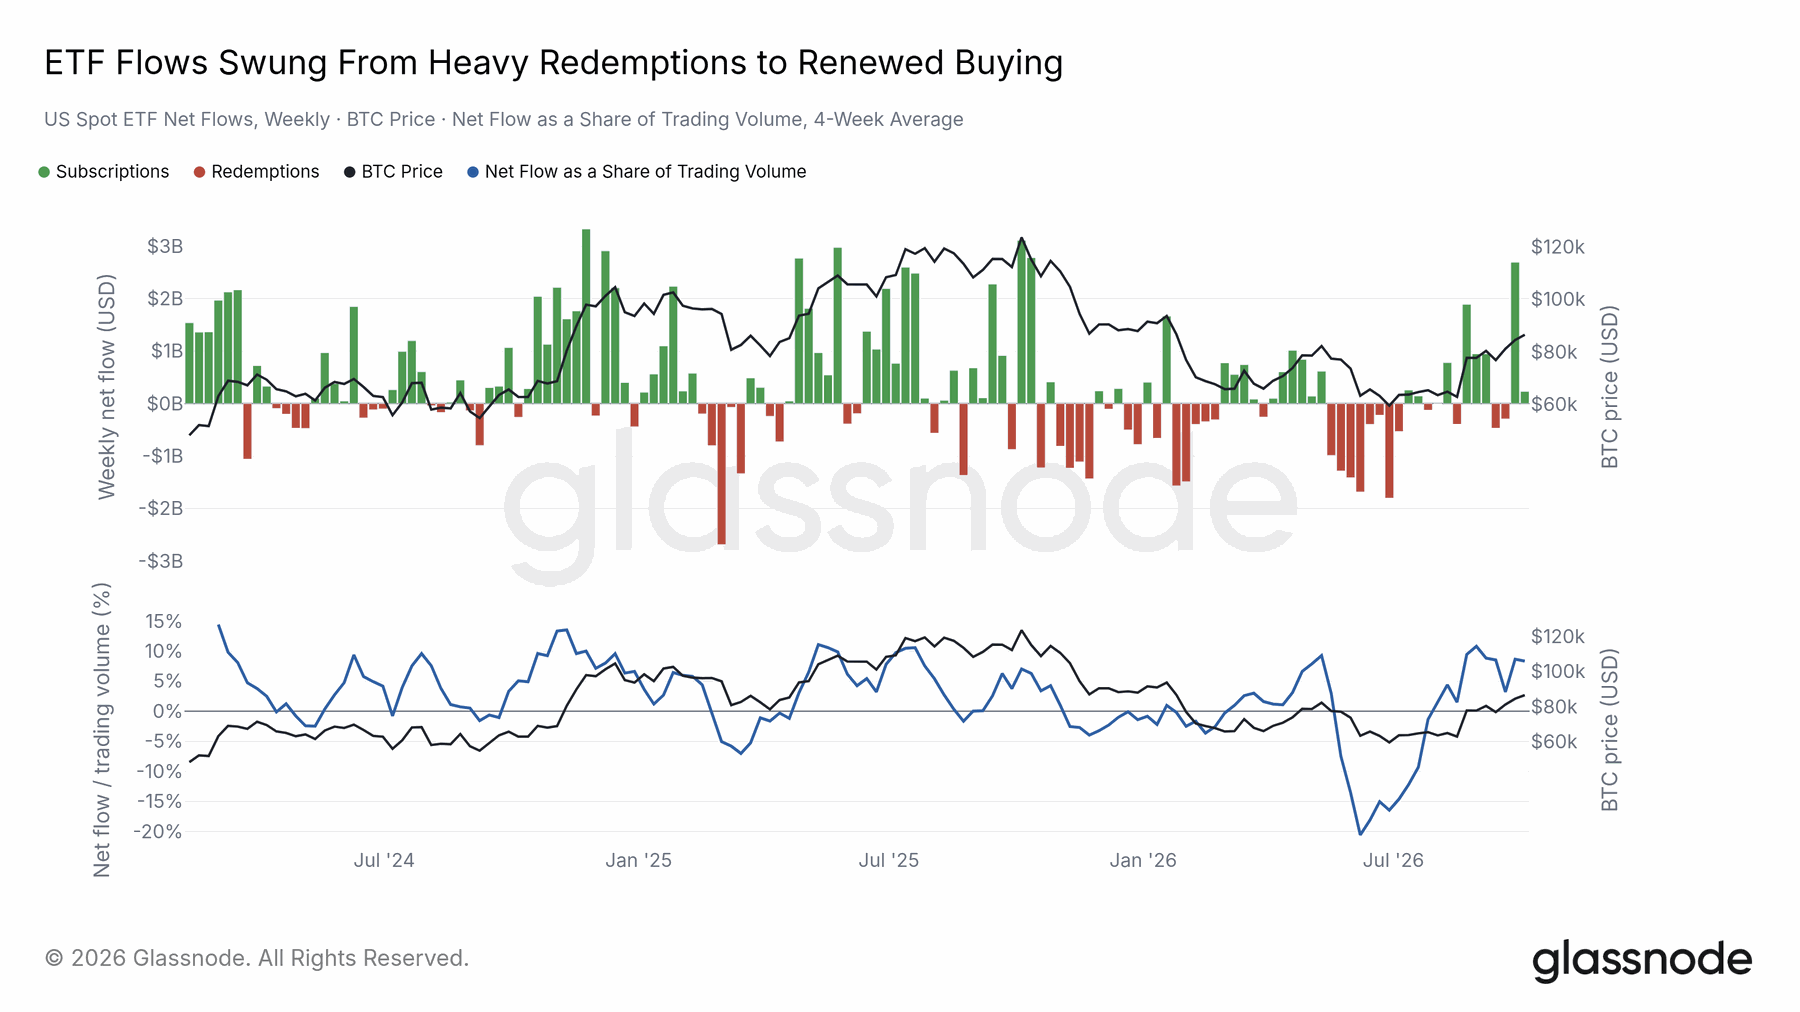
June saw $4.6 billion of net ETF outflows in the report, followed by $3.4 billion of net inflows in August and $2.6 billion in September. The week ending August 23 alone contributed $1.9 billion. The timing indicates that much of the buying followed the squeeze rather than preceding it. The report also divides four-week net flows by trading volume.
That ratio was 8.3% by early October, compared with a 2025 average of 2.3%. Trading turnover and net creations or redemptions are different measures: shares can change hands without changing the fund’s overall exposure. Further positive months would provide stronger evidence of persistent demand.
35 / Institutional allocators
Corporate Bitcoin exposure was highly concentrated
Strategy accounted for roughly two thirds of disclosed corporate Bitcoin in the report’s sample.
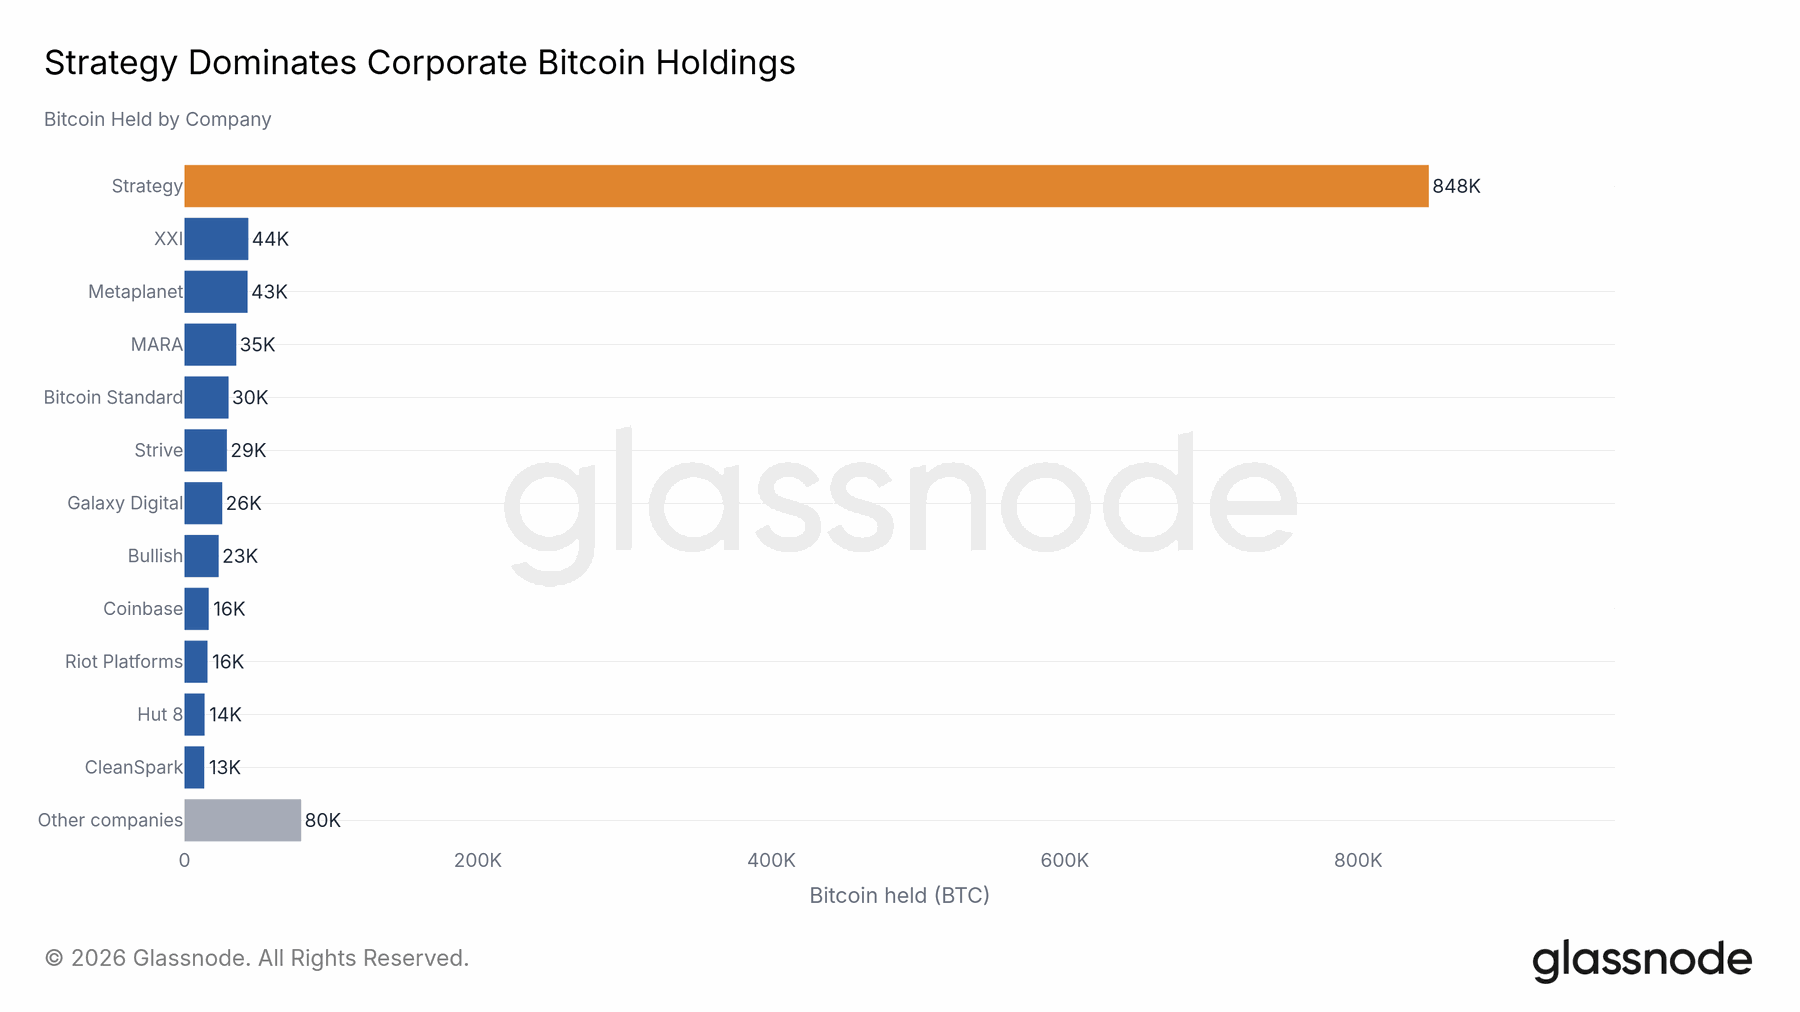
Tracked company disclosures totalled about 1.3 million BTC, worth around $108 billion at the report’s last settled close. Strategy held 848,000 BTC. The ten largest companies represented 85% of the sector, while the second-largest position was only about one twentieth of Strategy’s. The named companies added 180,000 BTC during the year, with Strategy responsible for nearly all of that increase.
This is a disclosure-based dataset, so reporting schedules affect when holdings appear. A broad corporate-sector headline can consequently depend heavily on the financing decisions and purchase activity of one company.
36 / Institutional allocators
Treasury strategies extended beyond Bitcoin
Ether matched Bitcoin’s corporate share of circulating supply despite a smaller company base.
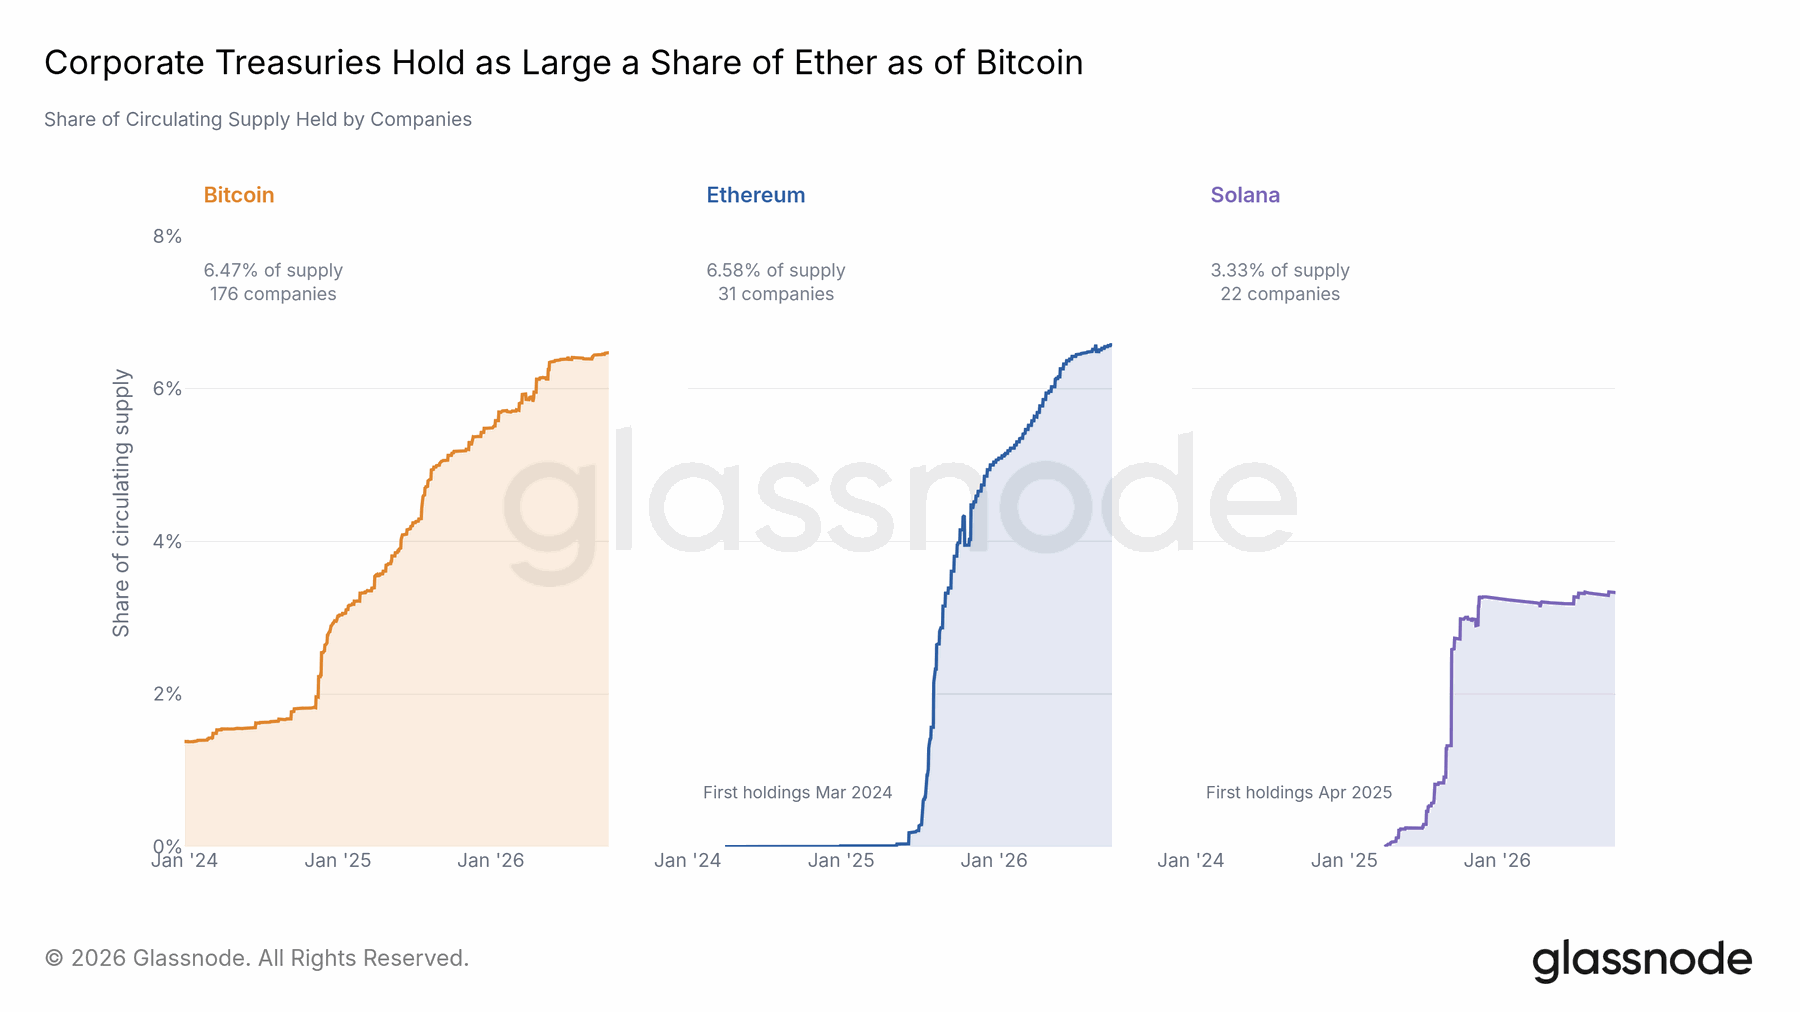
Companies held roughly 6.6% of Ether’s supply, similar to their Bitcoin share in the report. Corporate Solana holdings represented about half that supply share. Ether offered staking income, which could offset part of a leveraged treasury strategy’s financing cost, but that did not eliminate price, financing or operational risk. Since the start of December 2025, corporate holdings grew by 21% for Bitcoin, 43% for Ether and 7% for Solana in the report’s comparison.
Solana’s earlier accumulation had largely stalled. The contrast shows why treasury adoption should be assessed asset by asset rather than treated as a single uniform source of demand.
37 / Practical conclusion
Conclusion: a recovery that needs follow-through
The report’s central message is simple: a weak period for crypto prices did not stop the development of crypto markets. Settlement networks, institutional access and new trading products continued to grow, even as participation in many existing assets declined. The recovery therefore deserves attention, but it needs confirmation. Repeated ETF inflows, stronger spot buying and sustained improvements in on-chain capital measures would make the case more convincing. A rally driven mainly by liquidations would be less durable evidence. Market size is not the same as trading quality. Before interpreting a large volume number or a deep-looking order book, ask what is being measured, which venues are covered and how much an order could cost to execute.
The same care applies to tokenized shares, perpetual contracts and corporate treasury holdings: similar labels can hide different exposures. For readers, the most useful approach is to follow a small set of consistent signals and update the interpretation as conditions change. The constructive scenario is a recovery supported by continuing demand and improving execution conditions. The weaker scenario is renewed selling, fading inflows and rallies that cannot hold their gains. Neither outcome should be assumed from one strong week.
#bitcoin #market structure #institutional adoption #derivatives #stablecoins #tokenization




No comments yet
Be the first to share your perspective.