BTC OVERVIEW FROM GLASSNODE

PUBLISHED: 2026-11-07
CATEGORY: Market Analysis
Bitcoin has returned to the support levels reclaimed during August. This review of Glassnode’s November 4, 2026 Week On-chain report examines the reset in investor profitability, futures leverage and the demand needed to sustain the recovery.
The analysis explains the $73,000–76,000 support band, positioning around $87,000, subdued ETF participation and the deeper correction in altcoins. Localized charts summarize the report’s figures and a practical framework distinguishes stabilization from a failed breakout.
01 / Executive view
Executive summary
Bitcoin’s retreat has changed the balance between unrealized gains and losses. Recent buyers who had substantial profits now face a much less comfortable market, while part of the leveraged long exposure has already been unwound. That combination can reduce immediate selling pressure, but it does not establish a bottom. The report’s constructive case depends on support surviving and demand returning. The most useful distinction is between resilience and expansion.
Trading activity has remained above the pre-August baseline and Bitcoin has held up relatively well against traditional assets. Yet ETF outflows show that institutional demand is not providing a clear tailwind. A market can absorb selling without attracting enough new capital to start a sustained advance. The support test therefore deserves attention without treating it as a confirmed reversal.
02 / Investor positioning
Recent buyers have lost their profit cushion
Only about 38% of recent-holder supply remains in profit.
Glassnode · November 4, 2026, 11:00 UTC. ETF flows through November 2.
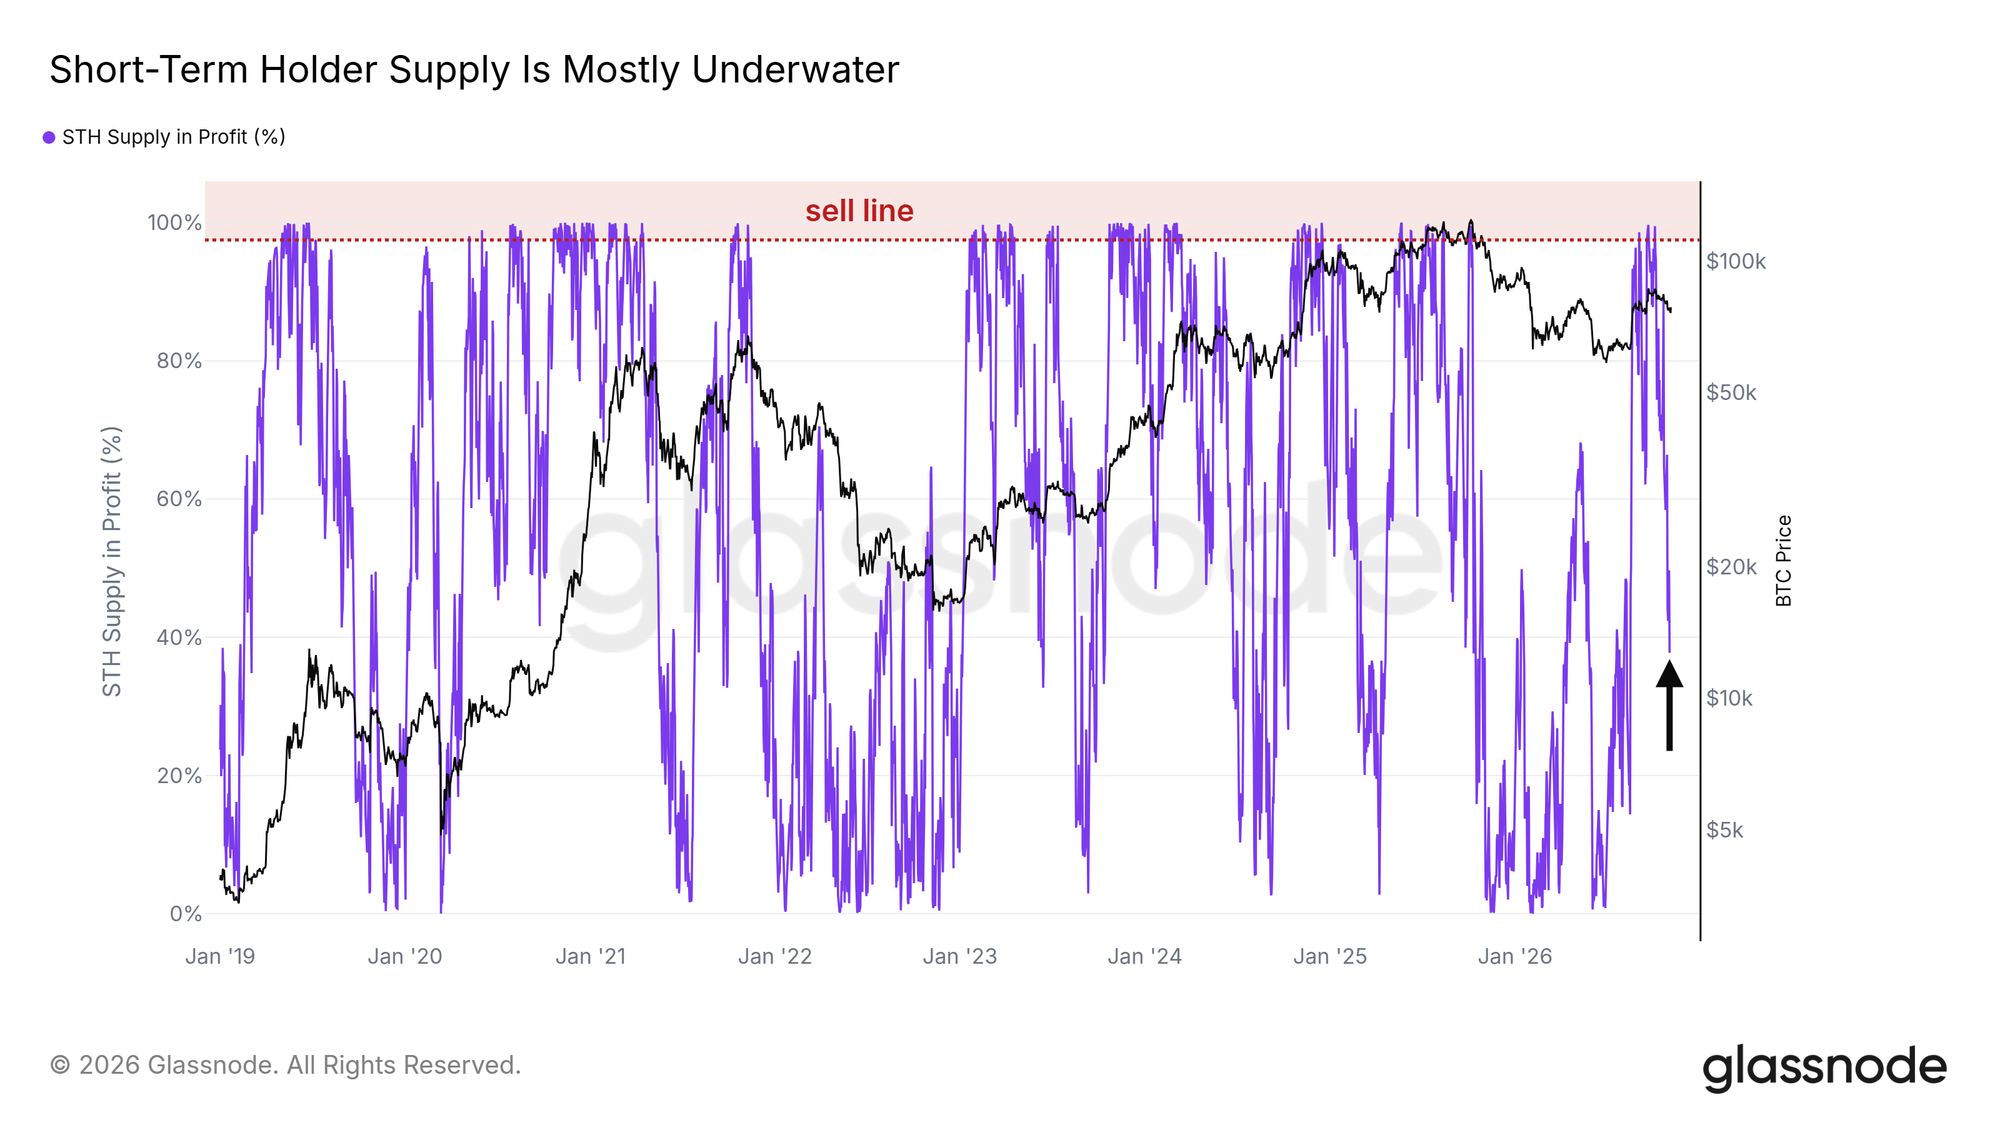
Glassnode defines short-term holders as coins held for less than 155 days. In early October, at least 97.5% of this cohort’s supply was in profit; the report’s latest reading was about 38%. These are shares of coins, not shares of investors or wallet accounts. The change describes the distribution of cost bases across recently moved supply. A lower profitable share reduces the pool of easy gains available to realize.
It can also create resistance when underwater buyers return to breakeven. A recovery above 50%, alongside a stable price, would indicate that more recent supply has moved back into profit. That threshold is a monitoring reference, not an automatic buy signal: price, volume and the persistence of the improvement still matter.
03 / Support structure
The August breakout is being tested
The key question is whether former resistance can hold as support.
Glassnode · November 4, 2026, 11:00 UTC. ETF flows through November 2.
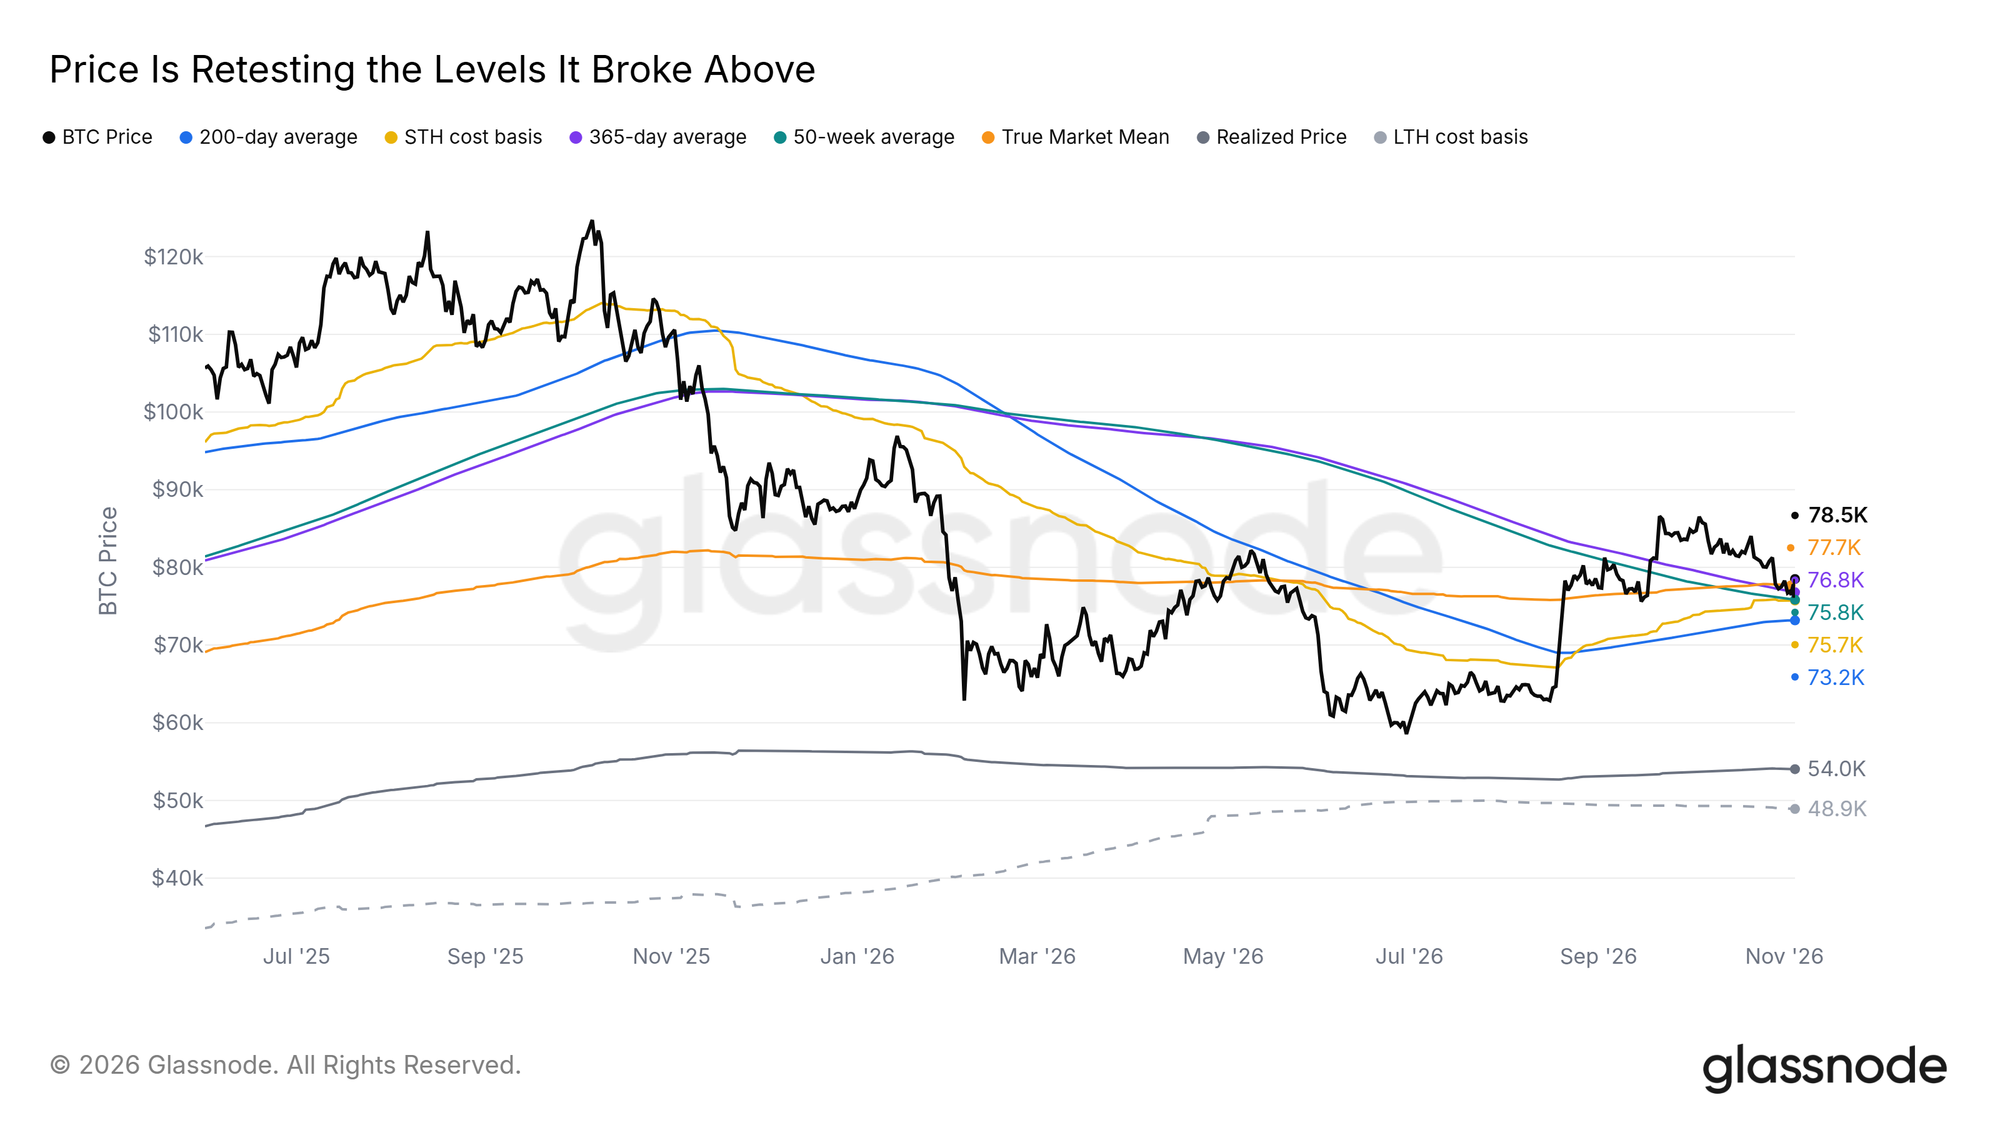
The report locates the True Market Mean near $77,700 and the short-term holder cost basis near $75,700. Bitcoin briefly closed below the former on November 3, traded down to about $76,100 overnight and then recovered above it. These values are the report’s snapshot, rather than live levels for the date this article is read. The 50-week average and the 200-day average provide additional context near the broader support area. Cost-basis levels describe where different groups acquired exposure.
They can influence decisions when holders defend positions or sell near breakeven, but they are not guaranteed floors. An isolated intraday breach is weaker evidence than repeated closes below a level followed by unsuccessful rebounds. In this framework, the $73,000–76,000 band is the more consequential area for judging whether the August recovery remains intact.
04 / Futures positioning
Lower long leverage, more shorts overhead
Liquidation maps describe potential amplification rather than certain targets.
Glassnode · November 4, 2026, 11:00 UTC. ETF flows through November 2.
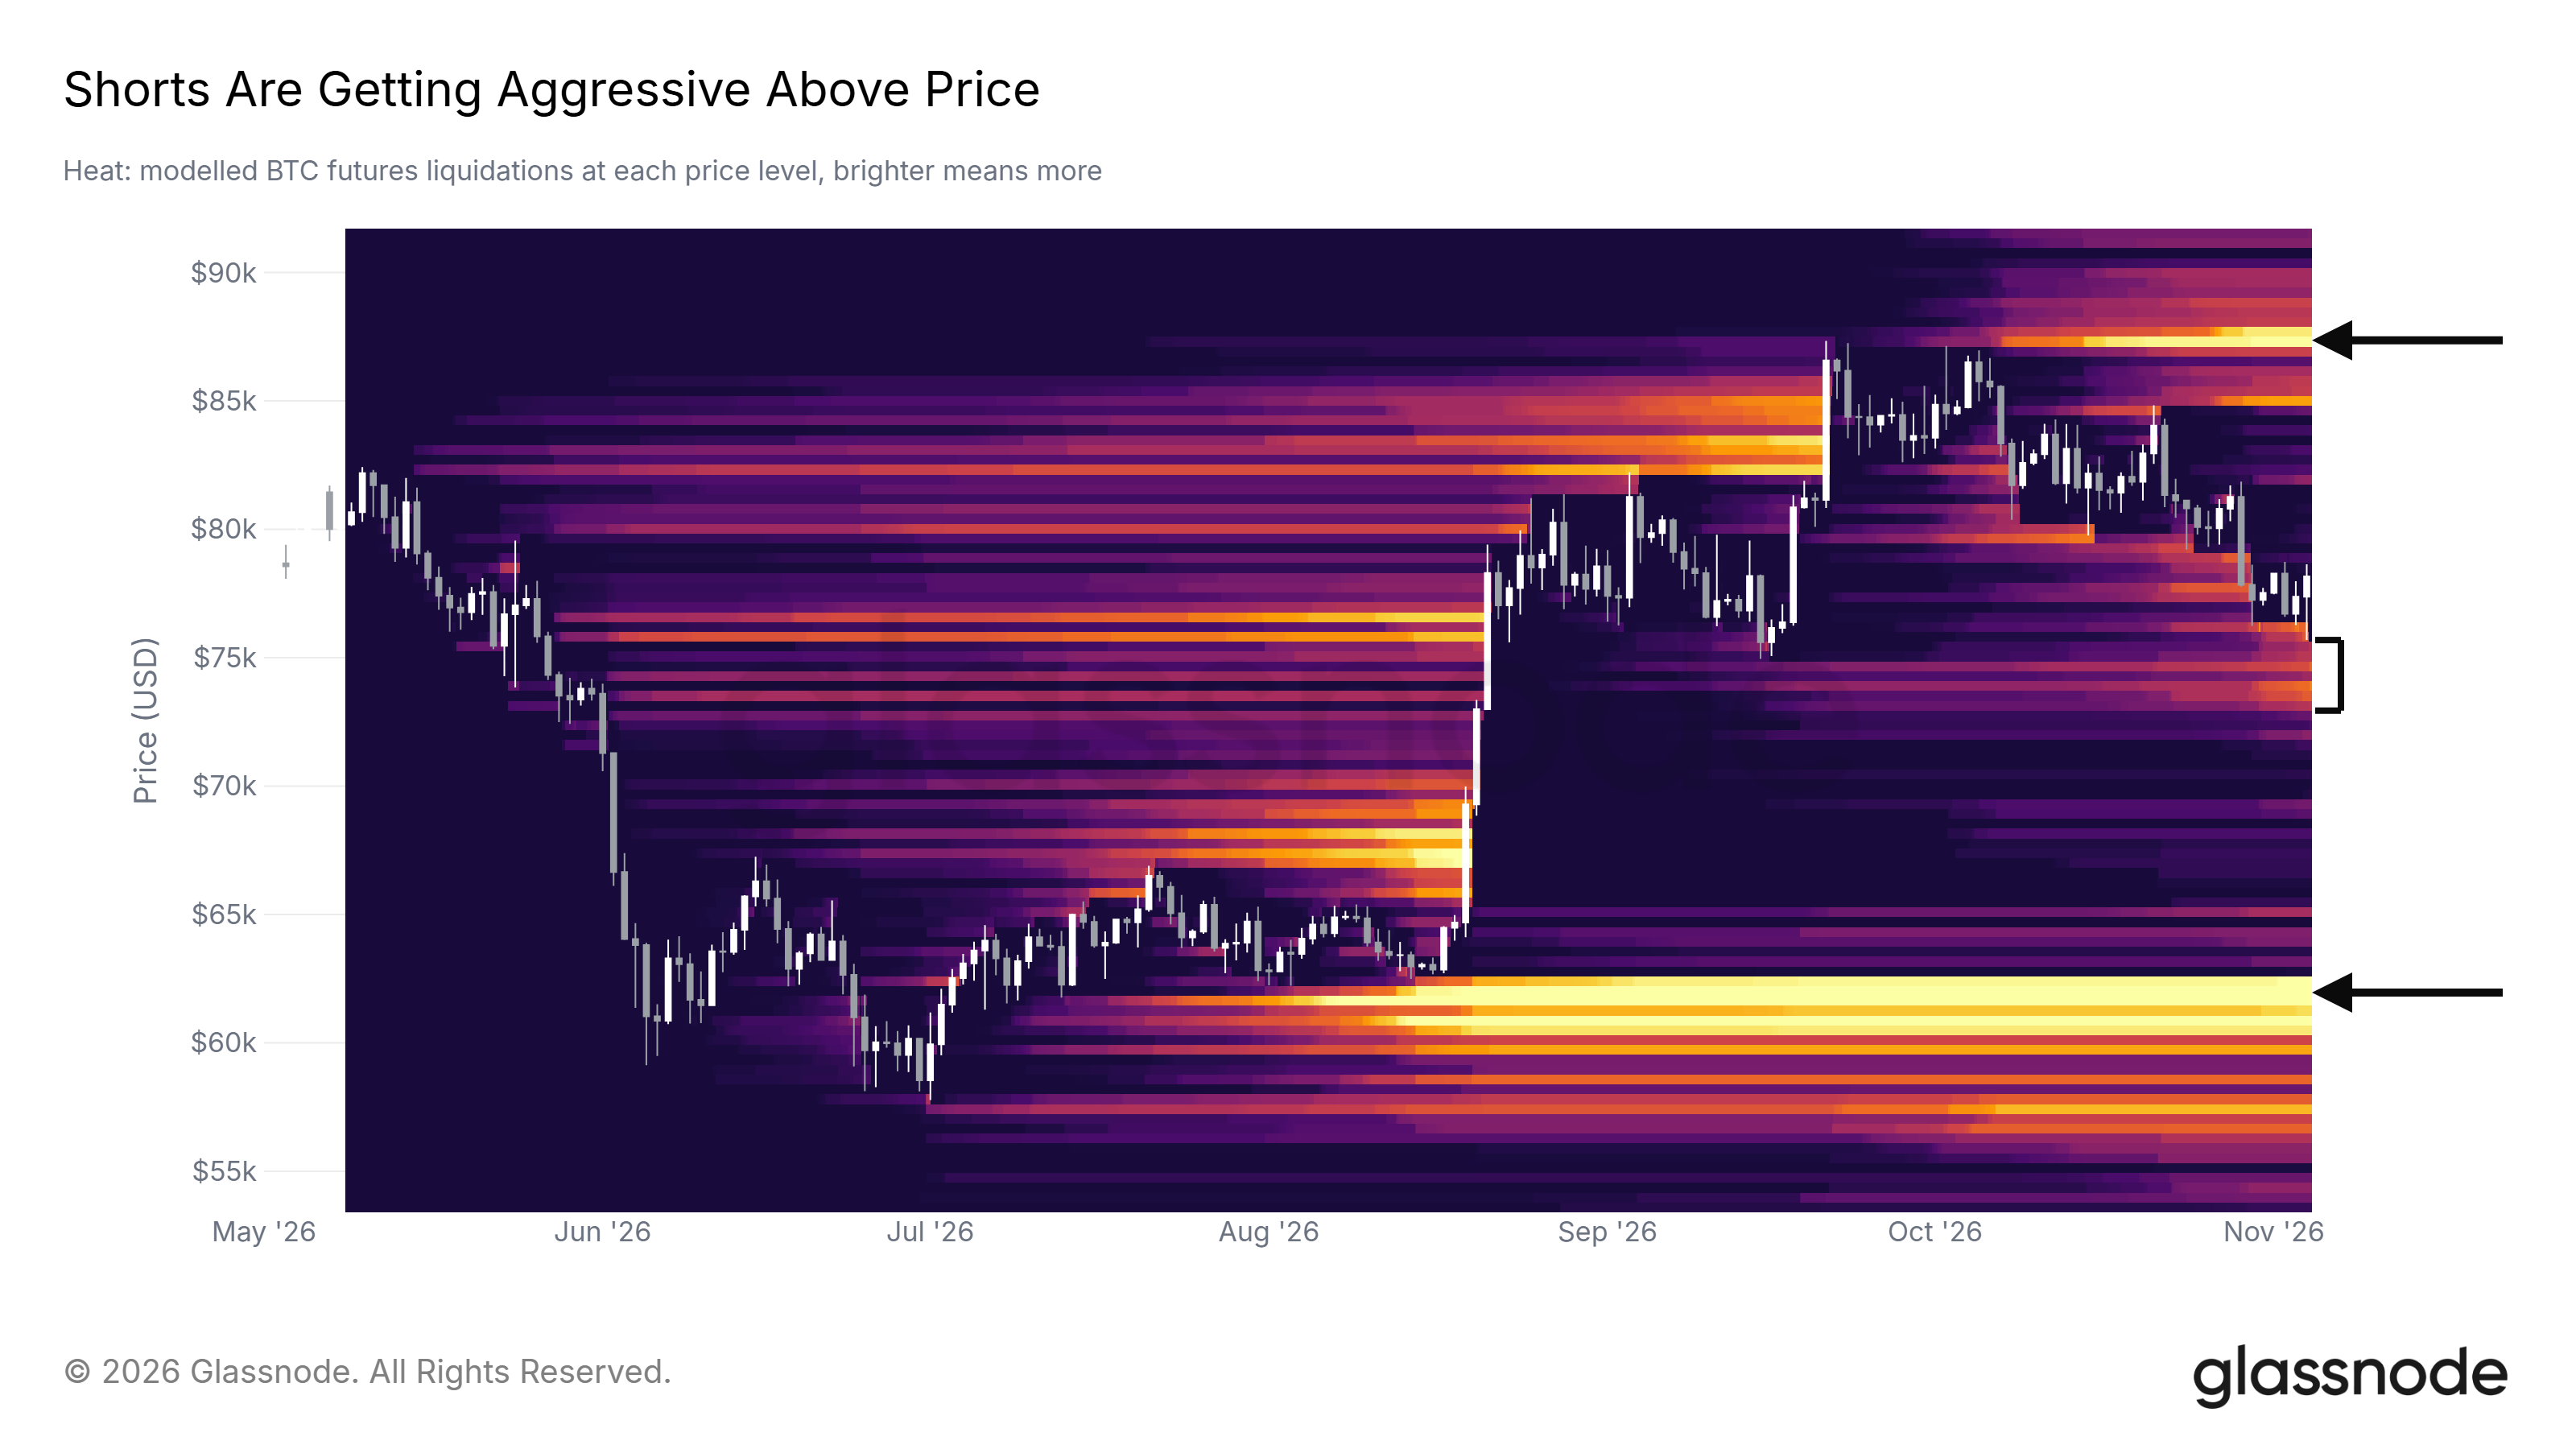
The decline cleared many modelled long-liquidation levels accumulated since August. The remaining nearby zone lies around $73,000–76,000, with a more distant concentration around $60,000–63,000. A heatmap estimates where leveraged positions may be liquidated; it is not an order book, a list of certain future trades or proof that price must visit those levels. Above price, the report identifies an expanding short-liquidation cluster near $87,000 despite a roughly 3.5% weekly decline.
If price rises into crowded shorts, forced repurchases can amplify the move. The opposite also matters: traders can close or re-margin positions before liquidation. The map helps explain potential acceleration once a move starts; it cannot supply its timing or guarantee its direction.
05 / Options
Upside exposure comes with important caveats
Calls exceed puts, but open interest is not a direct measure of bullish conviction.
Glassnode · November 4, 2026, 11:00 UTC. ETF flows through November 2.
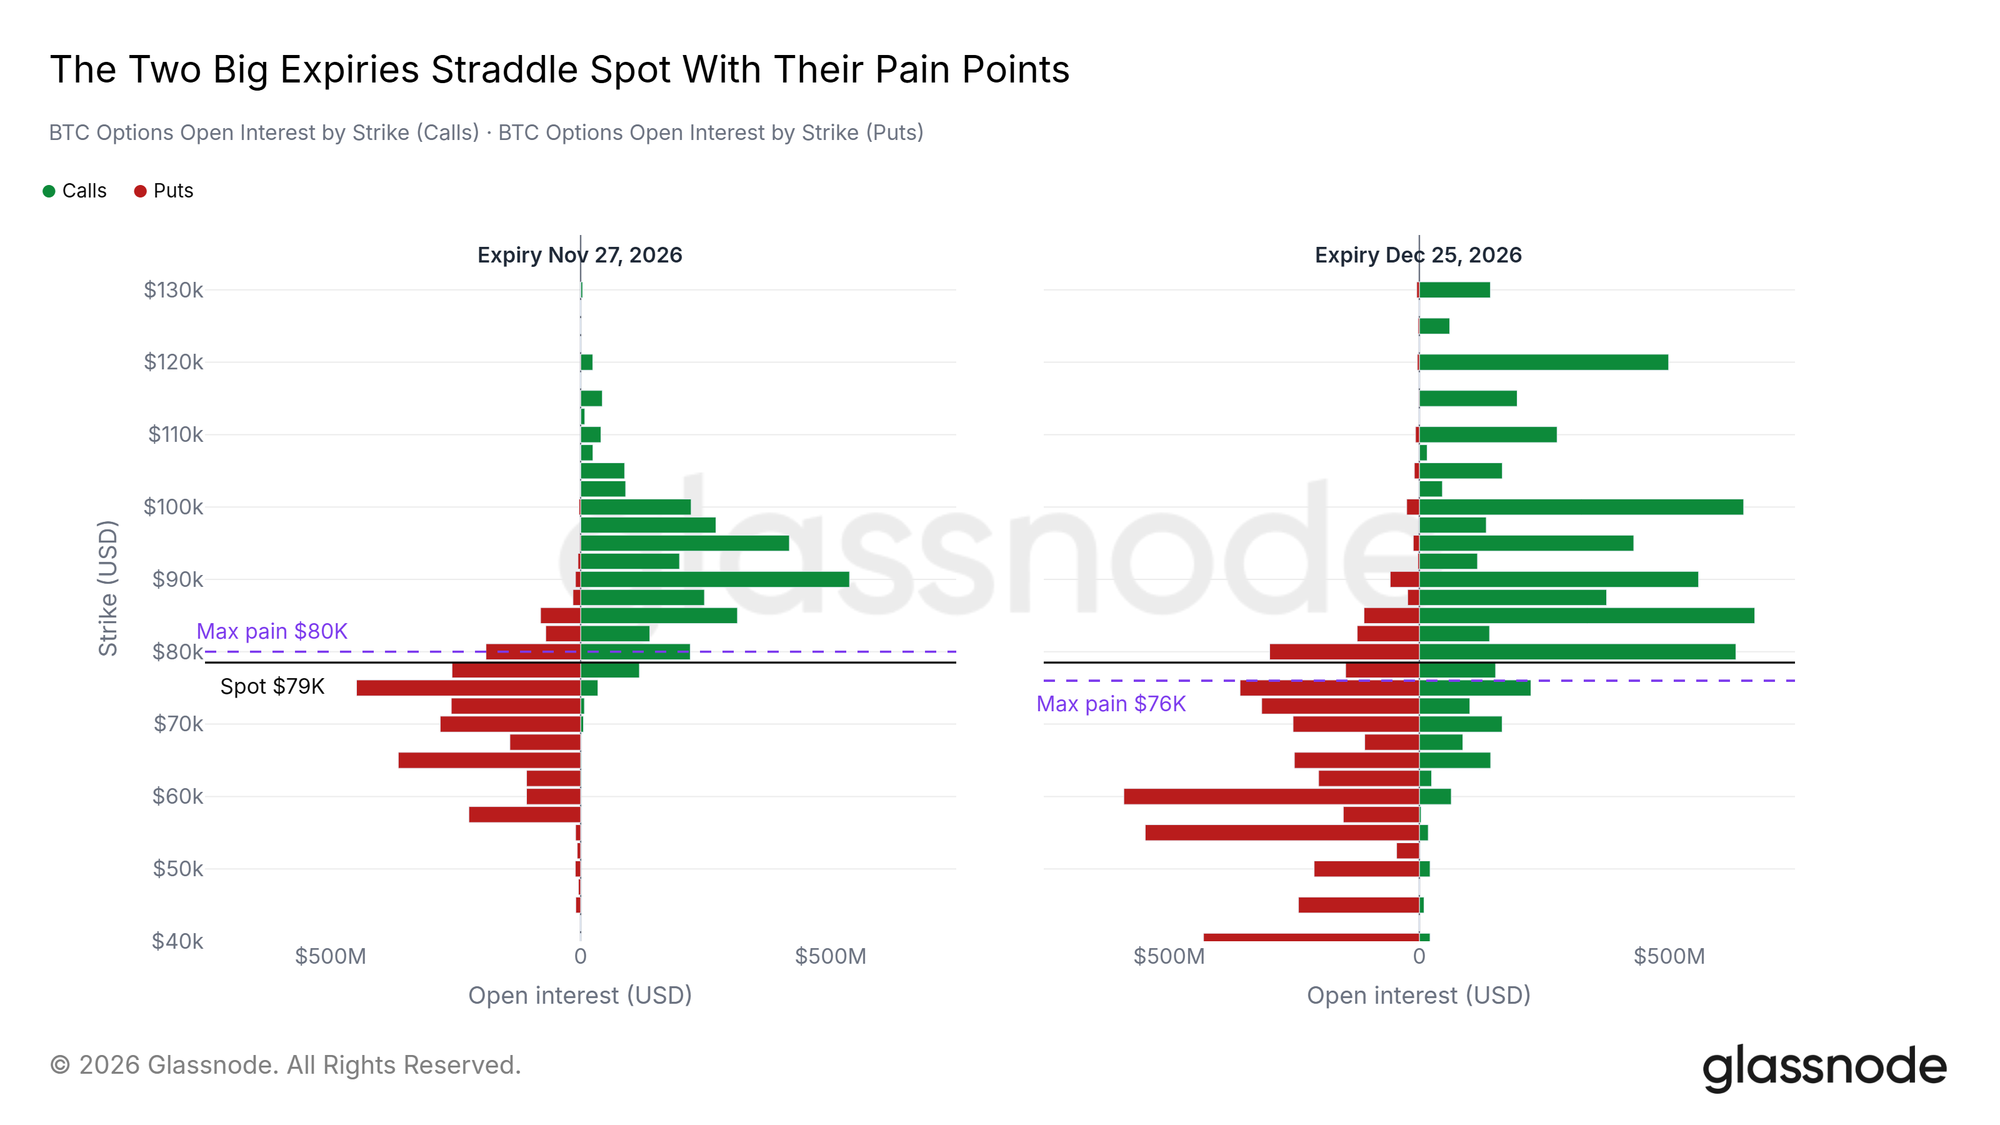
Across expiries, the report records roughly $18 billion in call open interest and $13 billion in puts. The November 27 and December 25 expiries account for $5.7 billion and $12.5 billion respectively. These are outstanding contract exposures, not net cash invested or a directional vote weighted by investor conviction. Every open option has both a buyer and a seller. Large December call positions sit at $80,000, $90,000, $100,000 and $120,000, while notable puts lie at $60,000 and below.
Calls may reflect speculative upside, hedges or covered-call selling. Similarly, max-pain levels of $80,000 for November and $76,000 for December do not force settlement there. Positioning describes possible sensitivity around expiry; it should be combined with spot demand rather than used as a price forecast.
06 / Market activity
Turnover has cooled without returning to the starting point
Activity remains around 1.5 times its pre-breakout baseline.
Glassnode · November 4, 2026, 11:00 UTC. ETF flows through November 2.
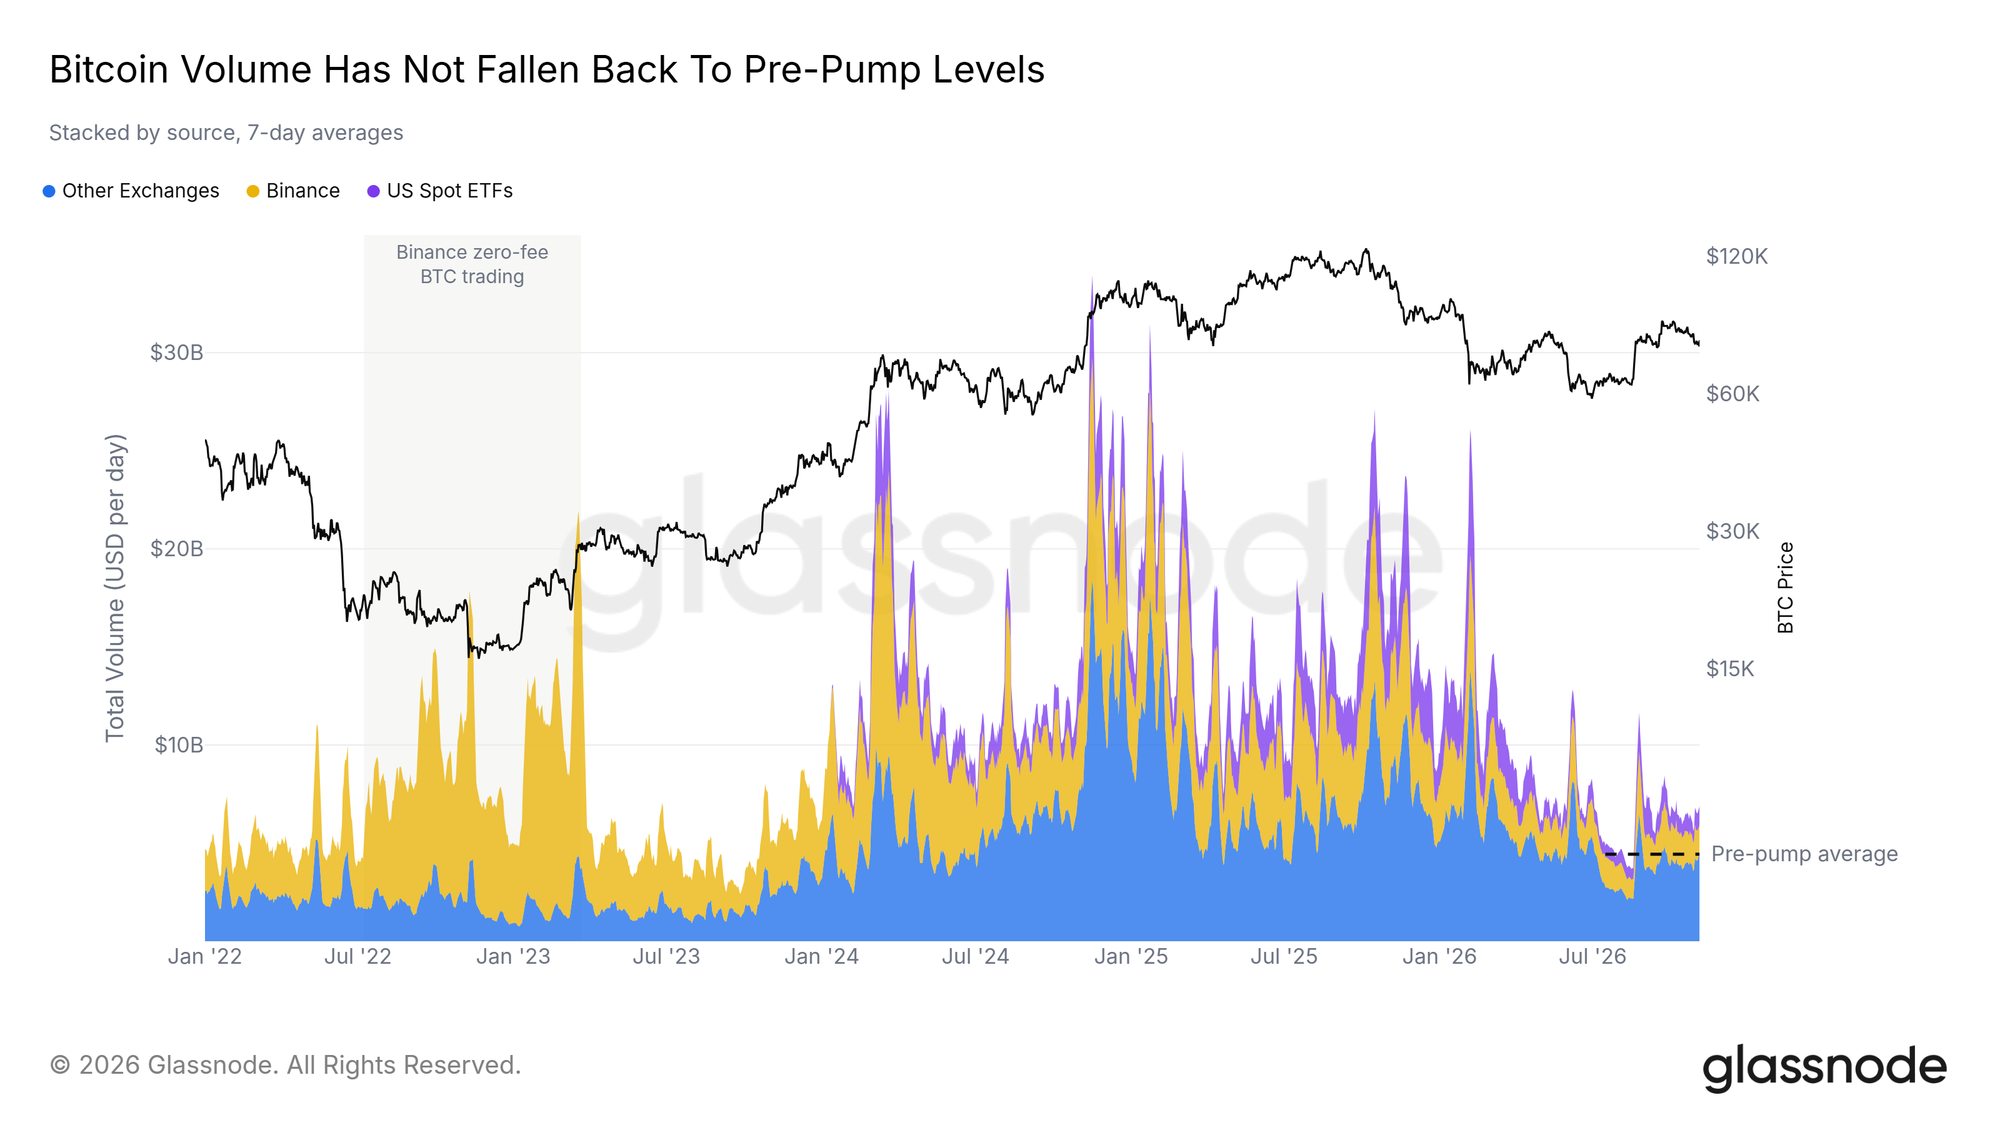
On a seven-day-average basis, combined spot and ETF turnover remained about 1.5 times the mid-July to mid-August baseline. That is consistent with some of the participation attracted by the breakout remaining active during the correction. It is a relative comparison to a quiet period, so it should not be confused with exceptionally strong volume by the standards of the ETF era. Volume measures transactions, not the net arrival of fresh money.
The same capital can trade repeatedly or rotate between assets. Healthy turnover becomes more persuasive when it accompanies higher prices, improving execution and durable net inflows. A rebound with fading participation would be a weaker confirmation, even if activity remained above its old baseline. The composition of demand matters as much as the headline volume.
07 / Institutional demand
ETF flows are the missing confirmation
Trading activity has persisted while institutional net flows remain weak.
Glassnode · November 4, 2026, 11:00 UTC. ETF flows through November 2.
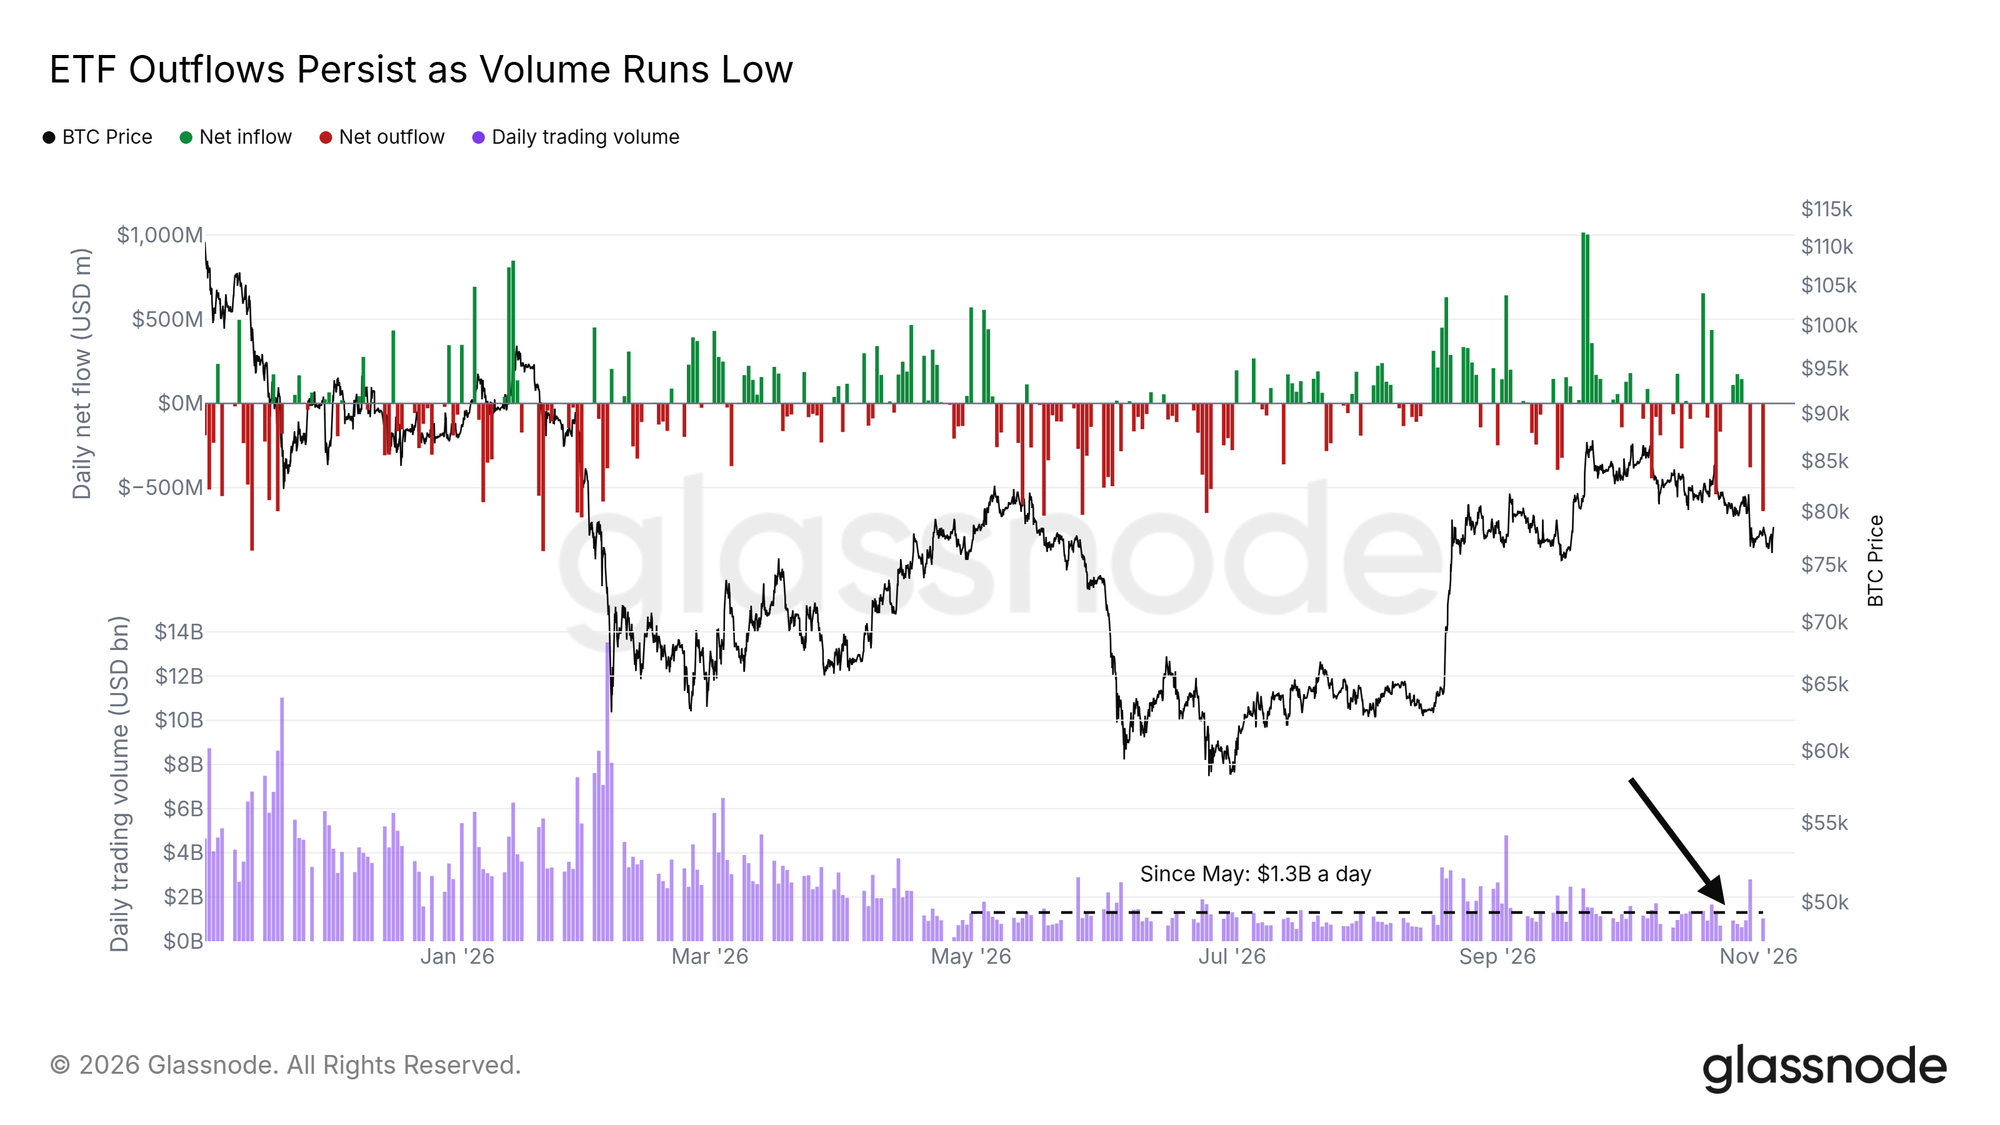
US spot Bitcoin ETFs saw nearly $1 billion of net outflows over the report’s two-week window, including approximately $640 million on November 2. ETF turnover had run around $1.3 billion per day since May, roughly one third of its earlier pace. Net creations or redemptions and secondary-market trading volume measure different things and should not be added together as a single demand figure. Glassnode interprets the combination as activity driven largely by capital already inside crypto.
That reading explains how spot trading can stay active while traditional-investor participation looks subdued. ETF flows often react to price, so weakness in flows does not by itself predict the next decline. Repeated positive flows alongside stronger spot buying would nevertheless make a recovery more convincing than a rally led only by liquidations.
08 / Relative strength
Bitcoin has stopped consistently lagging equities
Relative resilience deserves attention alongside absolute returns.
Glassnode · November 4, 2026, 11:00 UTC. ETF flows through November 2.
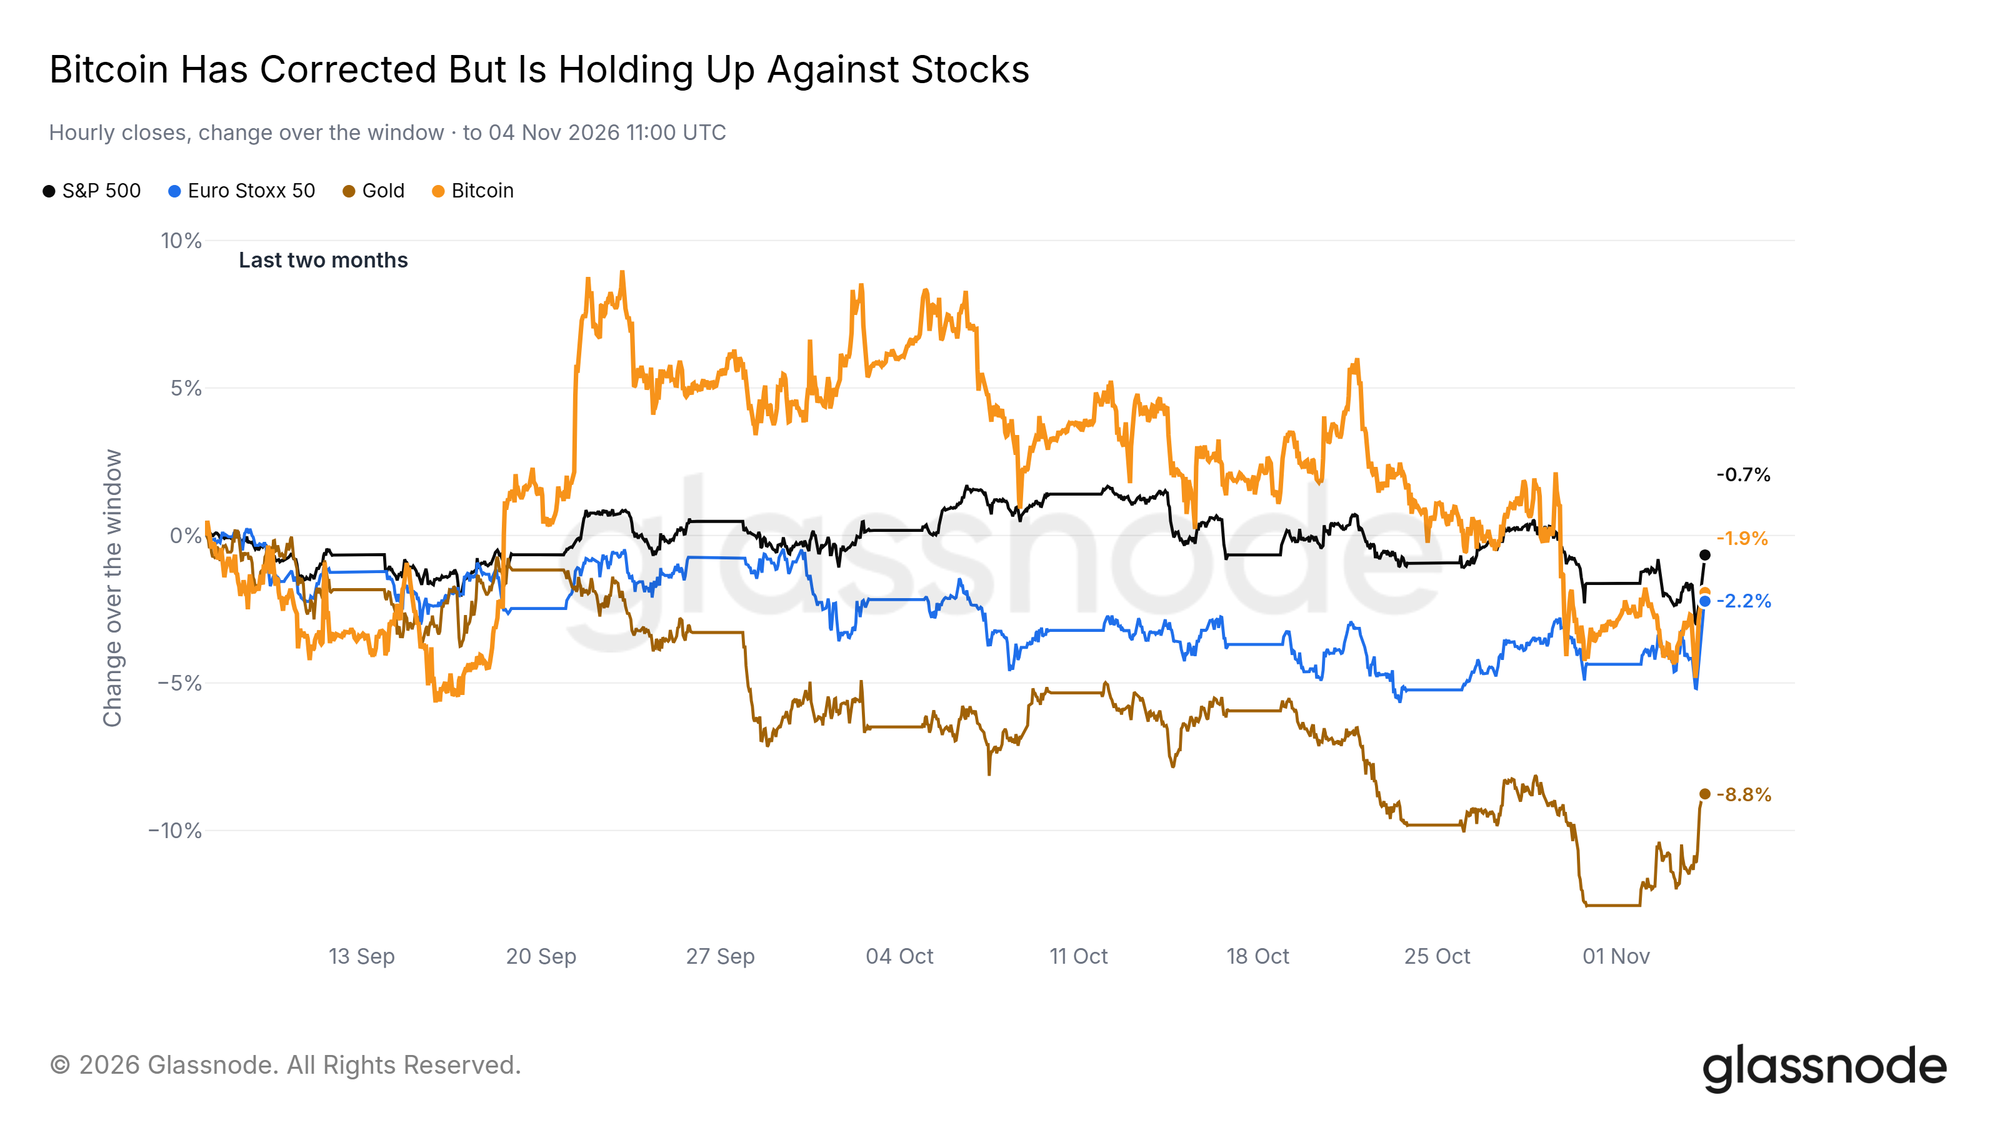
Over the report’s roughly two-month comparison, Bitcoin fell about 2%, the S&P 500 lost less than 1%, and gold declined around 9%. Bitcoin surrendered an earlier lead but remained broadly competitive with equities during its pullback. These are window-specific comparisons: moving the starting date can materially change the ranking, especially after a large August rally. A separate rolling measure shows Bitcoin outperforming the S&P 500 in around half of the previous 90 trading sessions.
That is an improvement after a long period below an even split, but not evidence that the two assets have decoupled. A sustained win rate above 50%, with better absolute returns, would be stronger confirmation. Relative resilience can coexist with losses in both assets during a broad risk-off move.
09 / Stress test
A muted reaction is evidence of absorption
The report describes an October 29 Binance security incident involving $6.3 billion in affected assets, citing the exchange’s own figure, and associates the subsequent period with a Bitcoin decline of about 3%. These event details are attributed to the report; the price response does not independently verify the incident’s scope, asset recovery or final economic loss. The useful market observation is the limited follow-through in selling. When severe news fails to cause a sustained breakdown, available bids may be absorbing supply.
That remains a conditional inference: positioning, prior expectations and other simultaneous events can also affect the response. Resilience to one shock does not remove exchange custody risk or replace the need for fresh demand. The ETF evidence remains relevant even when bad news produces little price damage.
10 / Political context
Midterm history is a small sample
Glassnode reports that Democrats won both chambers in the November 3 midterms. Its historical comparison notes a further Bitcoin decline after each of the previous three midterms, with drawdowns of 15%–50% within two to ten weeks. This is the report’s political and historical framing, rather than an independently verified forecast of policy or market outcomes. Three observations cannot establish a reliable election trading rule. Monetary conditions, starting valuations and market structure differed across those episodes.
The report also notes that much of this period’s decline preceded the vote and that institutional integration is deeper than in earlier cycles. A practical interpretation is to watch actual legislation and capital flows. An election result alone cannot determine the timing or magnitude of a Bitcoin bottom.
11 / Altcoin breadth
Loss realization has spread across tokens
Loss realization is widespread across the tracked altcoin universe.
Glassnode · November 4, 2026, 11:00 UTC. ETF flows through November 2.
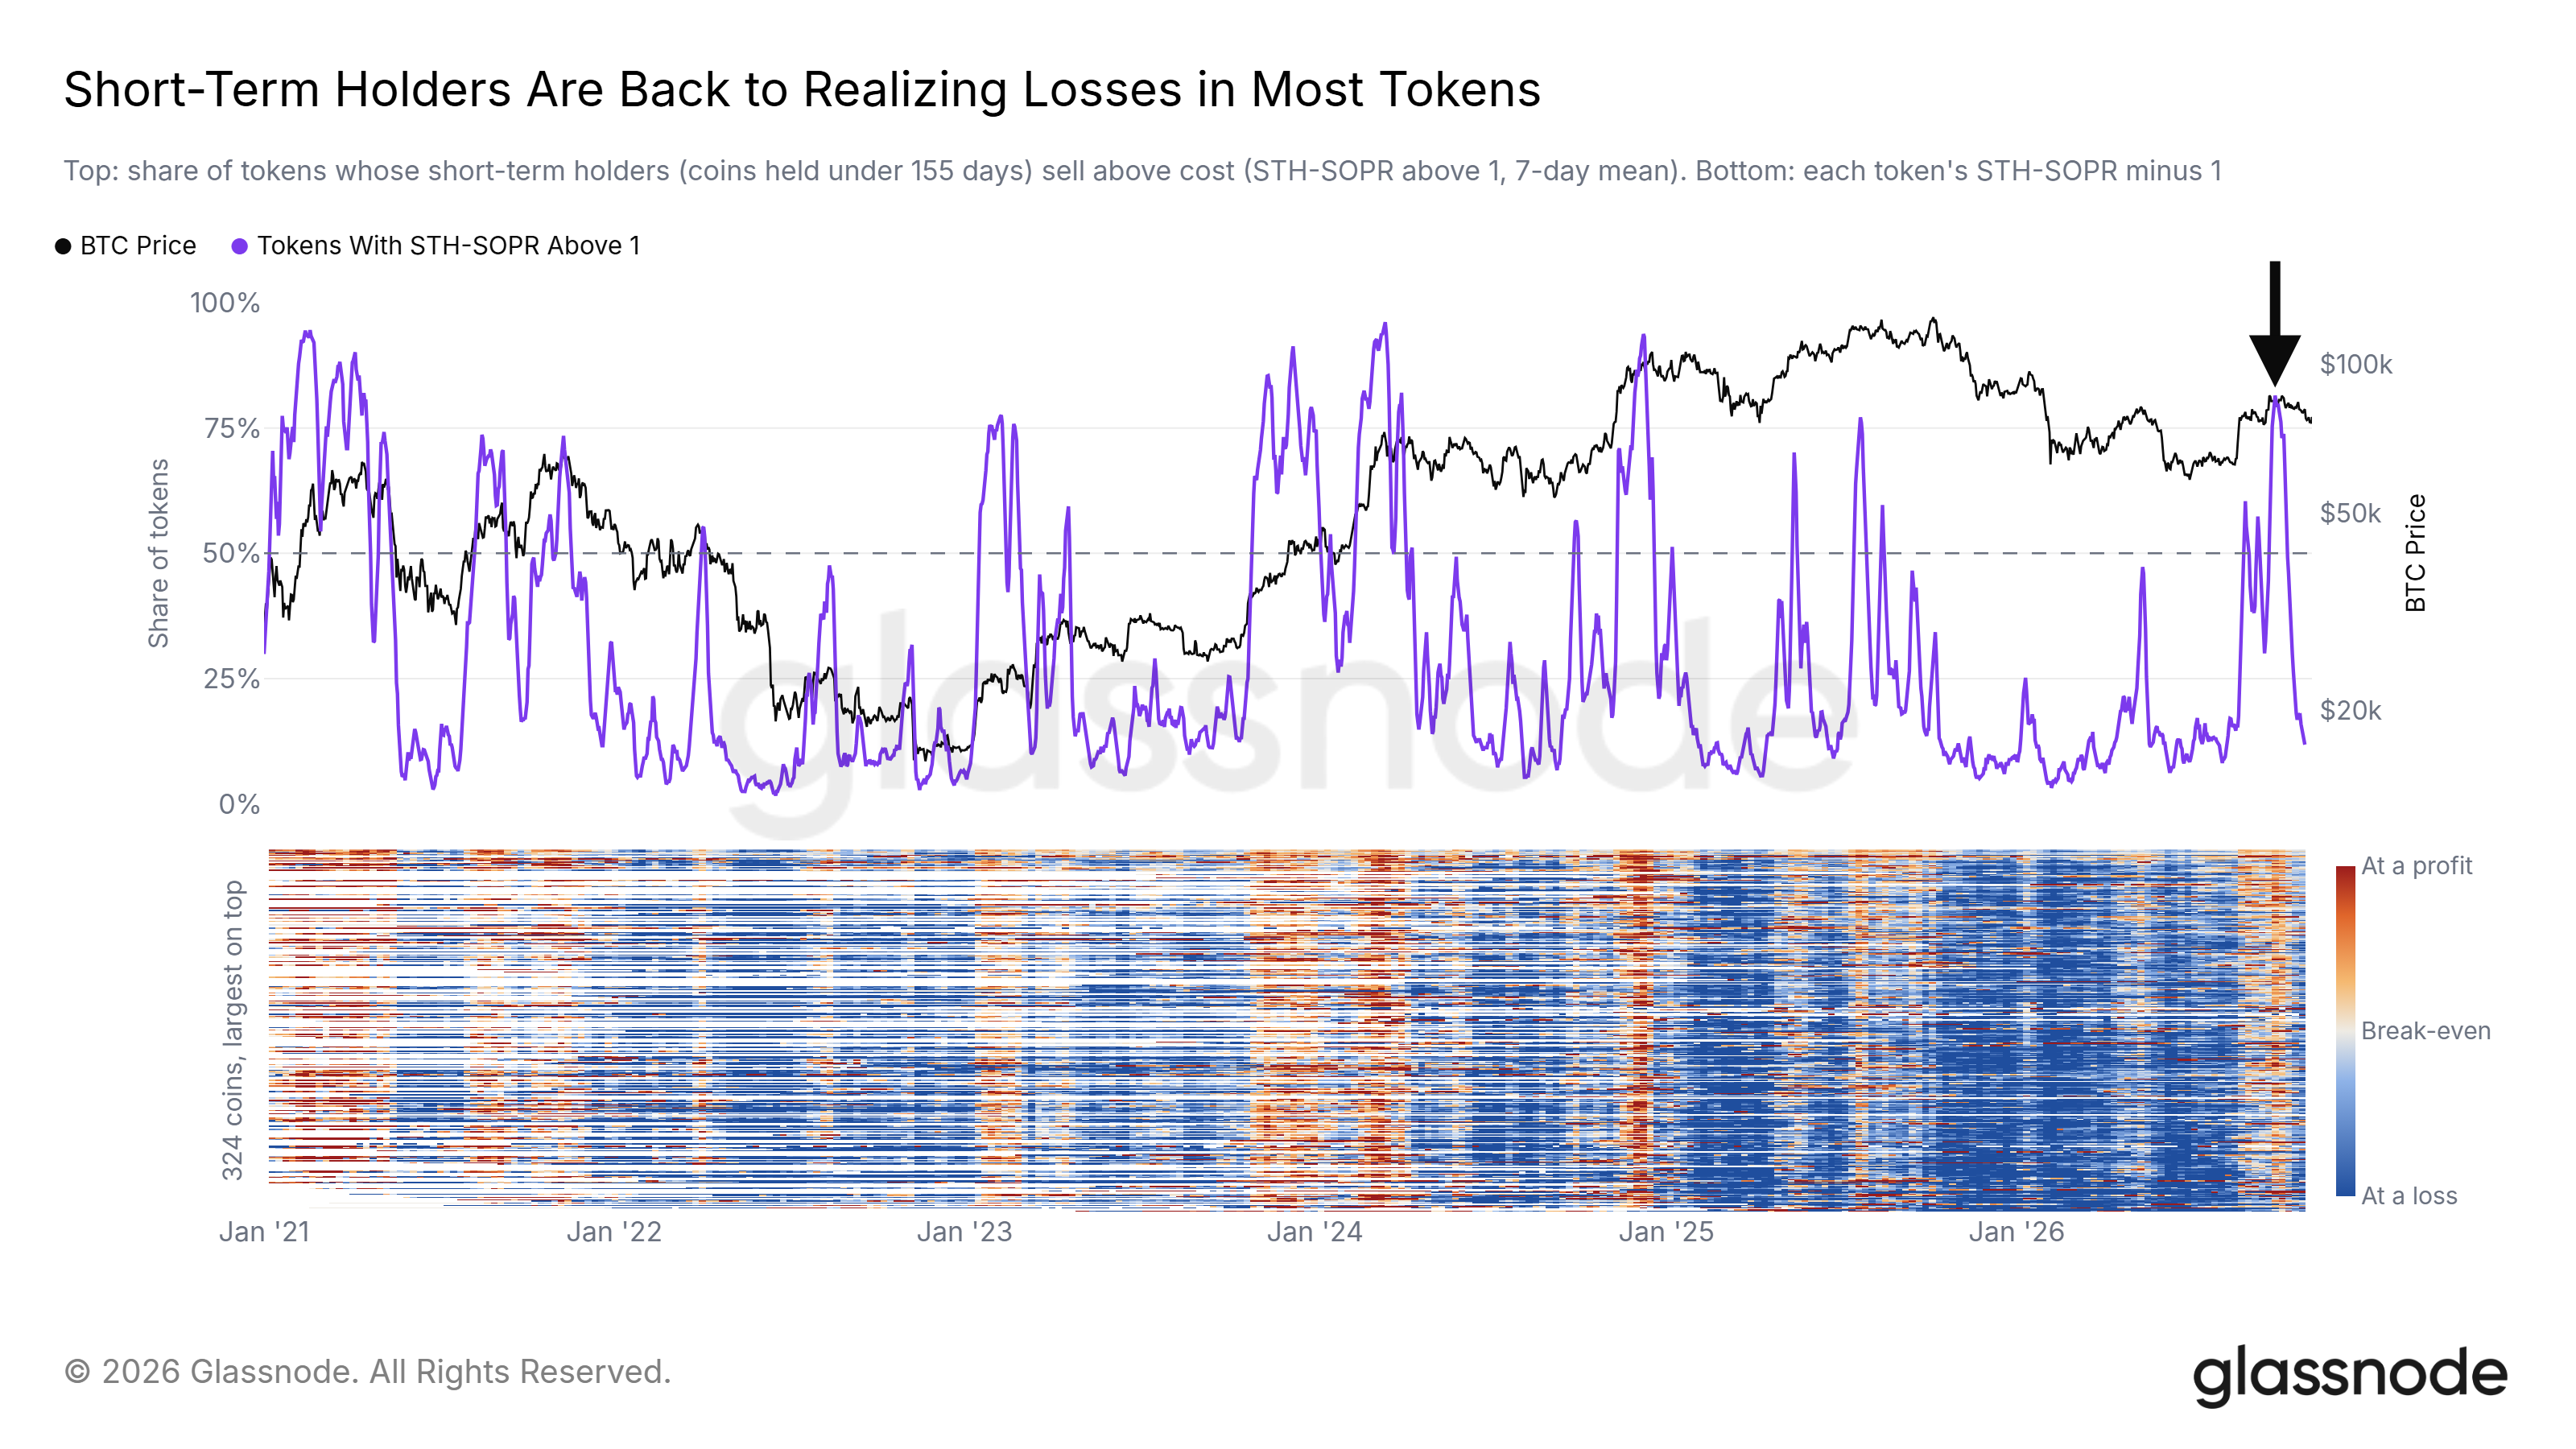
In late September, short-term holders were realizing profits in about 80% of more than 300 tracked tokens. By late October, the share was near 12%. The measure uses short-term holder SOPR: readings above one indicate aggregate profitable spending, while readings below one indicate loss realization. The percentage describes the breadth of tracked tokens, not the percentage loss of an altcoin portfolio. This reset can remove some short-term speculative excess, but broad losses do not prove that every token is cheap.
Assets differ in dilution, liquidity, adoption and the ability to attract capital. Bitcoin stabilizing would improve the backdrop; stronger breadth and sustained demand would be needed to support a broader recovery. A bounce concentrated in a few large tokens is weaker evidence than improvement across a meaningful portion of the same tracked universe.
12 / Practical conclusion
A support test needs confirmation
The constructive scenario is a durable defense of the $73,000–76,000 area, a recovery in recent-holder profitability and stronger spot participation. Under those conditions, a move toward overhead short exposure could accelerate. The $87,000 cluster is a positioning reference, not a promised destination. The neutral scenario is a prolonged range while leverage and investor cost bases continue to adjust. The weaker scenario is a sustained break below $73,000 with rebounds unable to reclaim support and continuing demand weakness.
The distant $60,000–63,000 liquidation zone then becomes relevant context, without becoming an inevitable target. The practical discipline is to update the thesis from several consistent signals and size exposure so that a failed support test remains manageable. Figures reflect Glassnode’s November 4, 2026, 11:00 UTC cutoff; ETF data runs through November 2.
#bitcoin #Glassnode #on-chain analysis #derivatives #ETFs #market structure




No comments yet
Be the first to share your perspective.