CAPITULATION MEETS SUPPORT

PUBLISHED: 2026-11-19
CATEGORY: Market Analysis
Glassnode’s November 17 report follows Bitcoin back to its August buying range and examines which investors absorbed the November sell-off.
The original charts trace realized losses, futures liquidations, spot demand and capital flows. They also show how altcoins and tokenized markets behaved during the decline. The key question that we are trying to answer is the bottom in, and if not what might be the levels of price to support the bottom.
01 / ImpulseTrade analysis · Glassnode research
Executive summary
When Bitcoin fell to roughly $62,000 on November 15, the clearest sign of support was where coins changed hands. Over the two heaviest days of selling, the amount of recently acquired BTC with a cost basis between $62,000 and $66,000 grew by about 66,000 BTC. Buyers absorbed supply where the August rally had begun.
Whether those buyers can sustain a recovery is a separate question. The Coinbase premium faded after the weekend, and US spot Bitcoin ETFs saw $2.6 billion in net outflows over ten trading days. Holding the August range would give a local floor time to form. Recovering $74,100, the average cost basis of recent holders in this snapshot, would be stronger confirmation.
02 / Glassnode
Realized losses
Glassnode · 17 Nov 2026 · 13:00 UTC
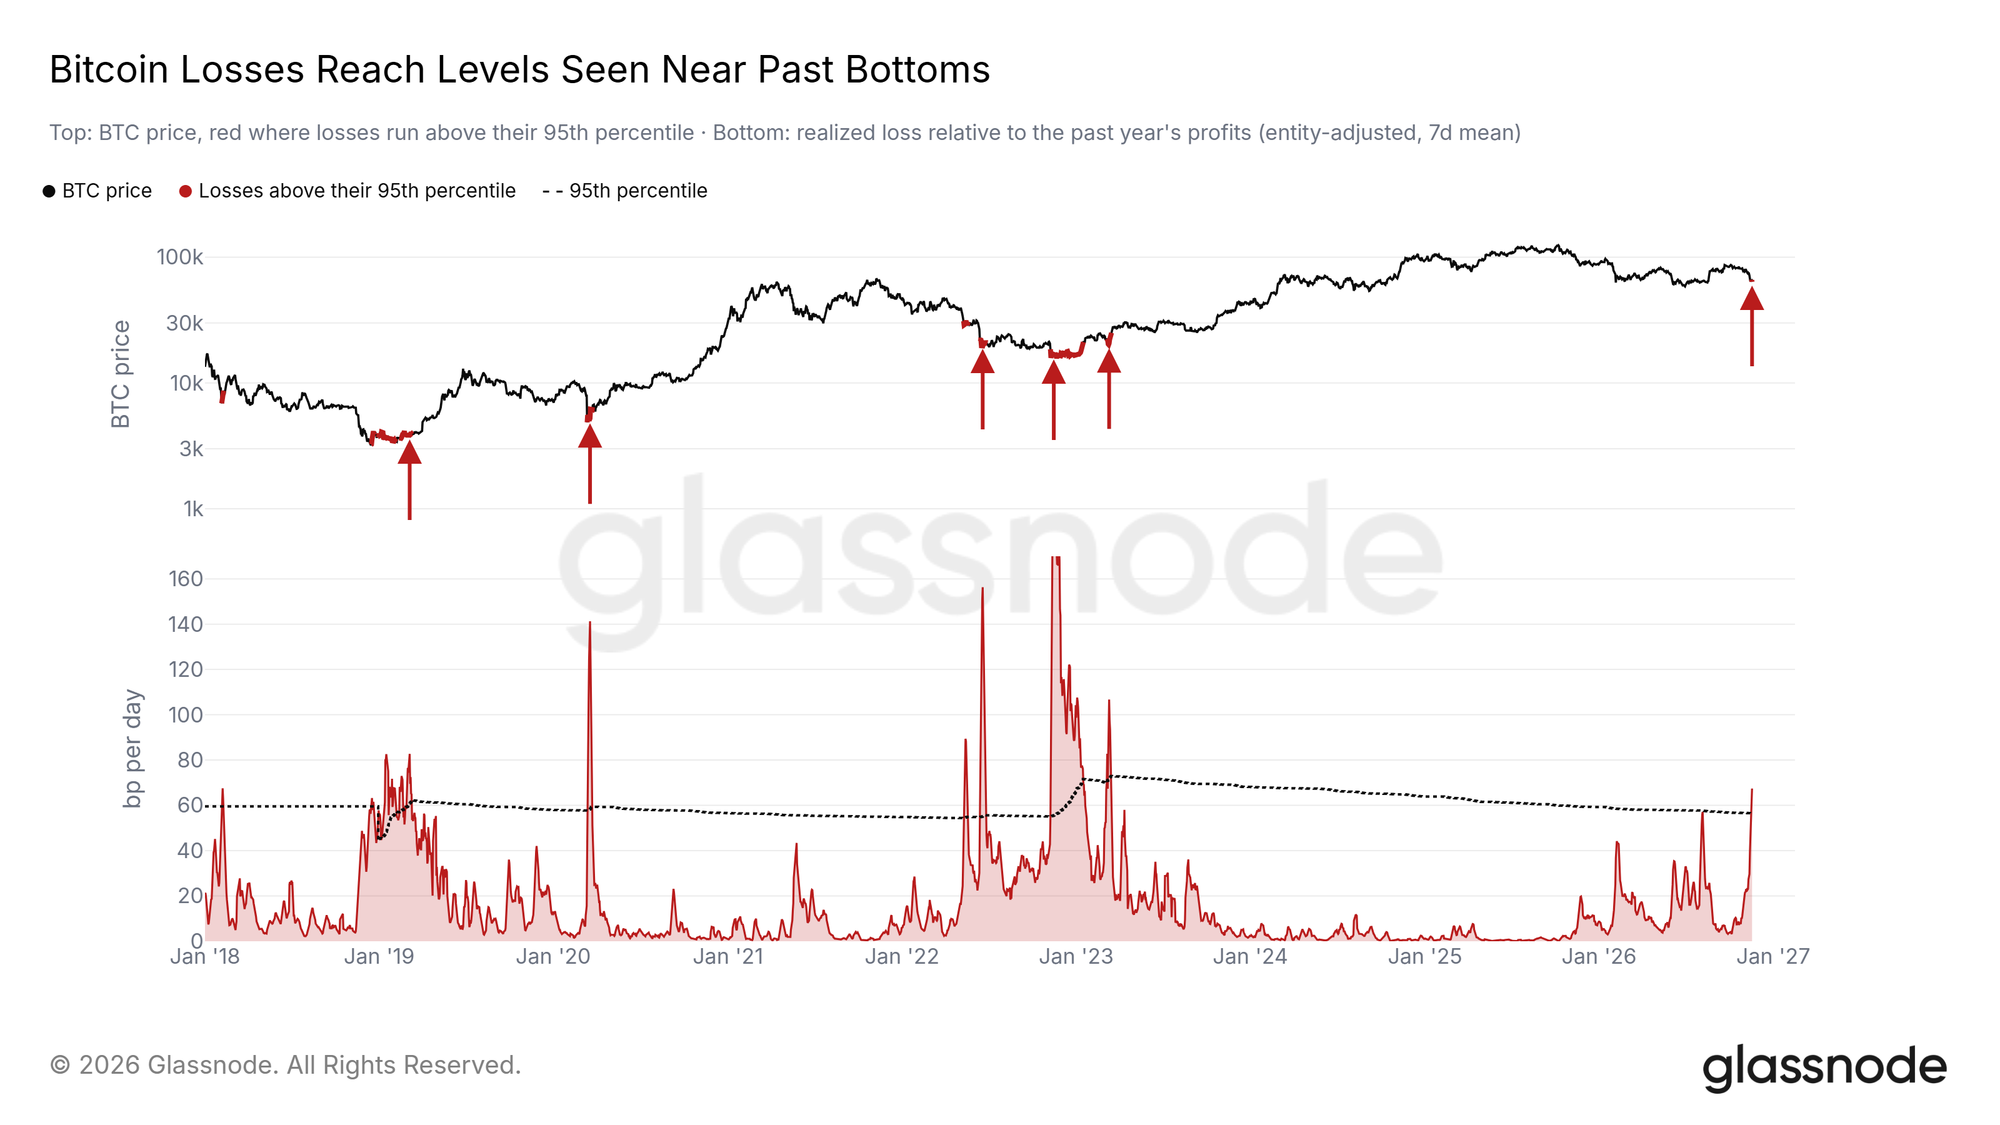
A realized loss is recorded when a coin moves at a lower price than on its previous transfer. Comparing those losses with the profits taken over the preceding year helps put a sell-off in context. On November 15 that measure reached a level last seen in early 2023.
Consider a coin that last moved at $80,000 and then changes hands at $64,000. It contributes $16,000 to gross realized losses. A surge in this measure shows that holders have accepted losses. The next test is whether a similar price decline still prompts the same volume of loss-taking.
03 / Glassnode
Losses by holding period
Glassnode · 17 Nov 2026 · 13:00 UTC
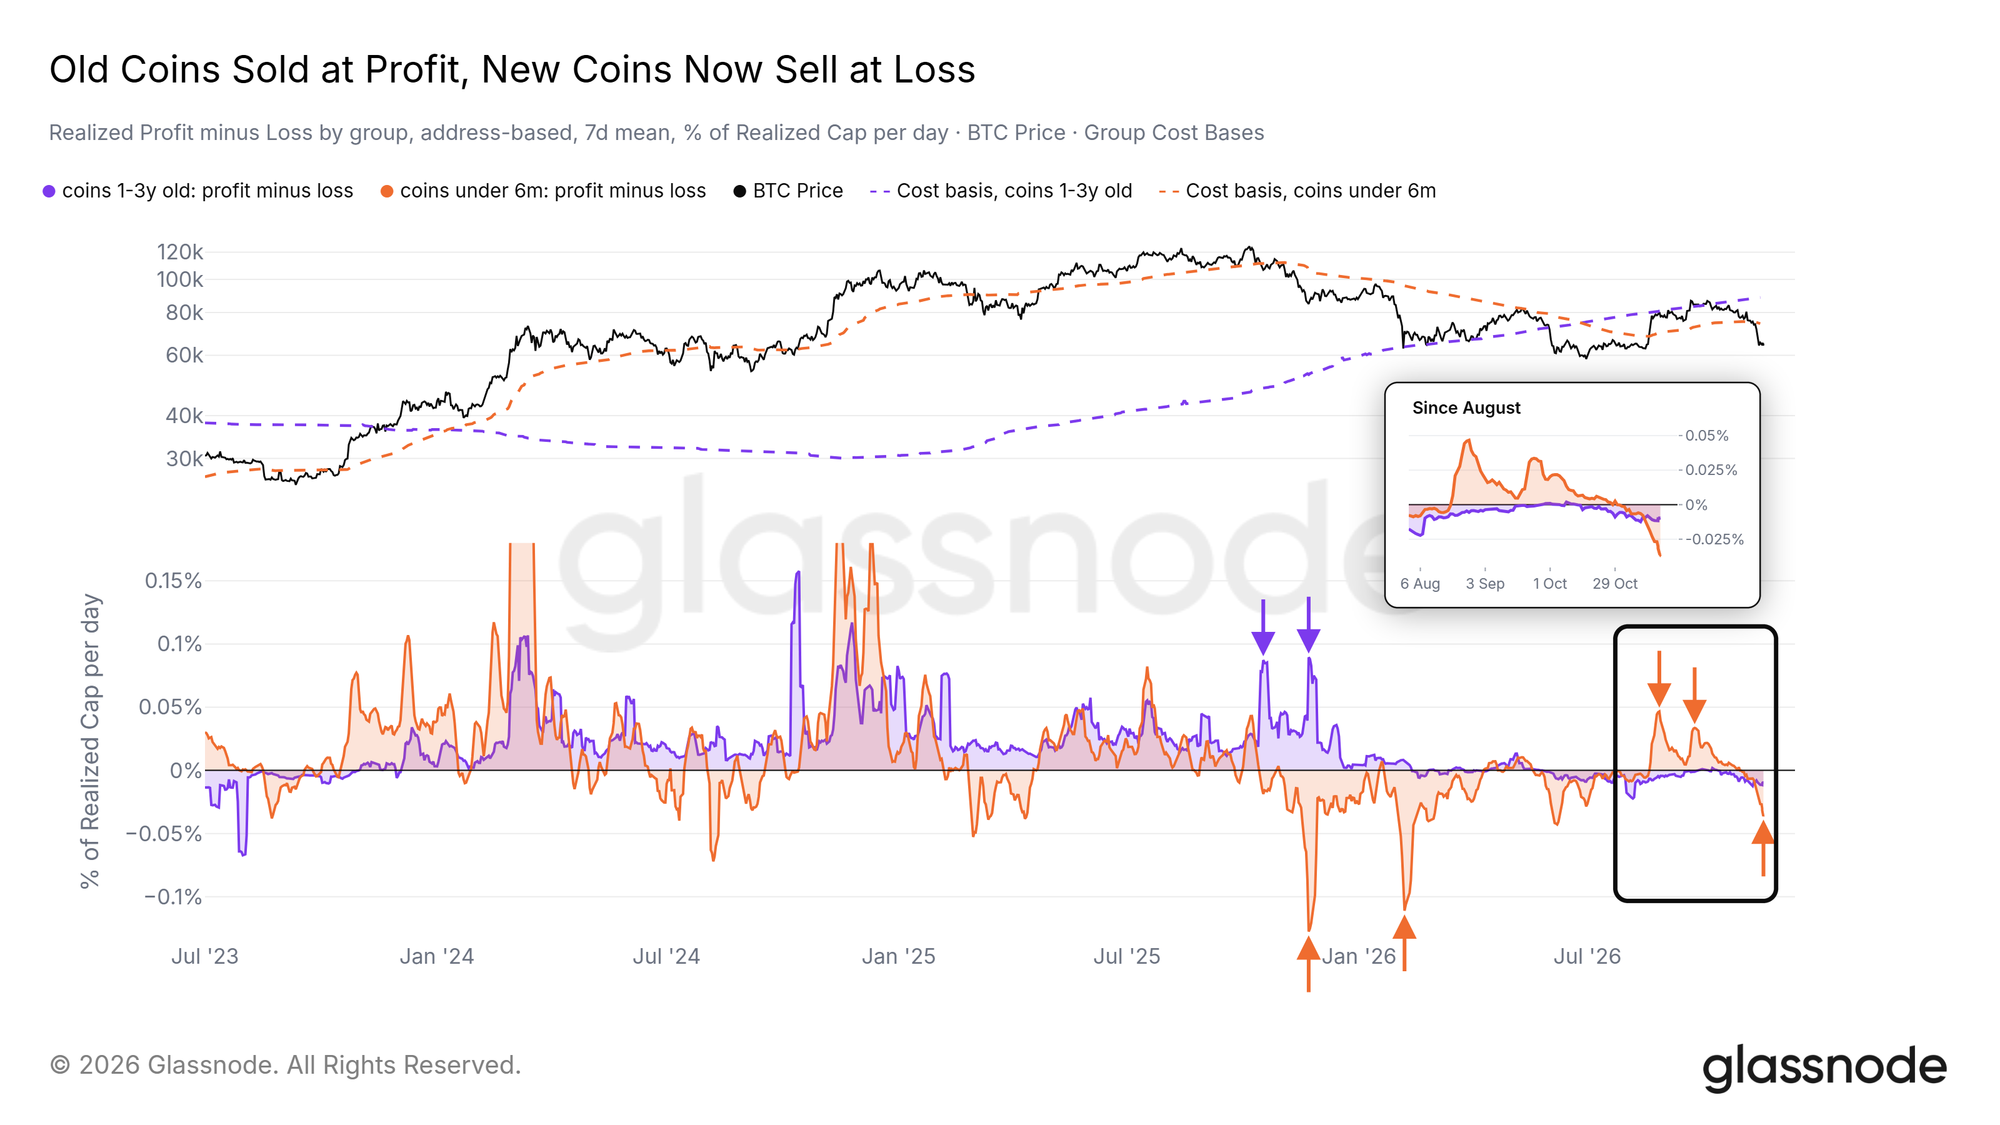
The age breakdown identifies the coins behind the loss spike. Coins less than six months old had moved at a profit during the September and October rally. As Bitcoin retraced that advance, coins in the same age group began moving at a loss again.
Coins held for one to three years show a different pattern. Their last substantial wave of profit-taking came in late 2025, and they played a smaller role in the November sell-off. Coin age measures time since the previous transfer. It helps locate the pressure within the supply without identifying individual sellers.
04 / Glassnode
Short-term holder cost basis
Glassnode · 17 Nov 2026 · 13:00 UTC
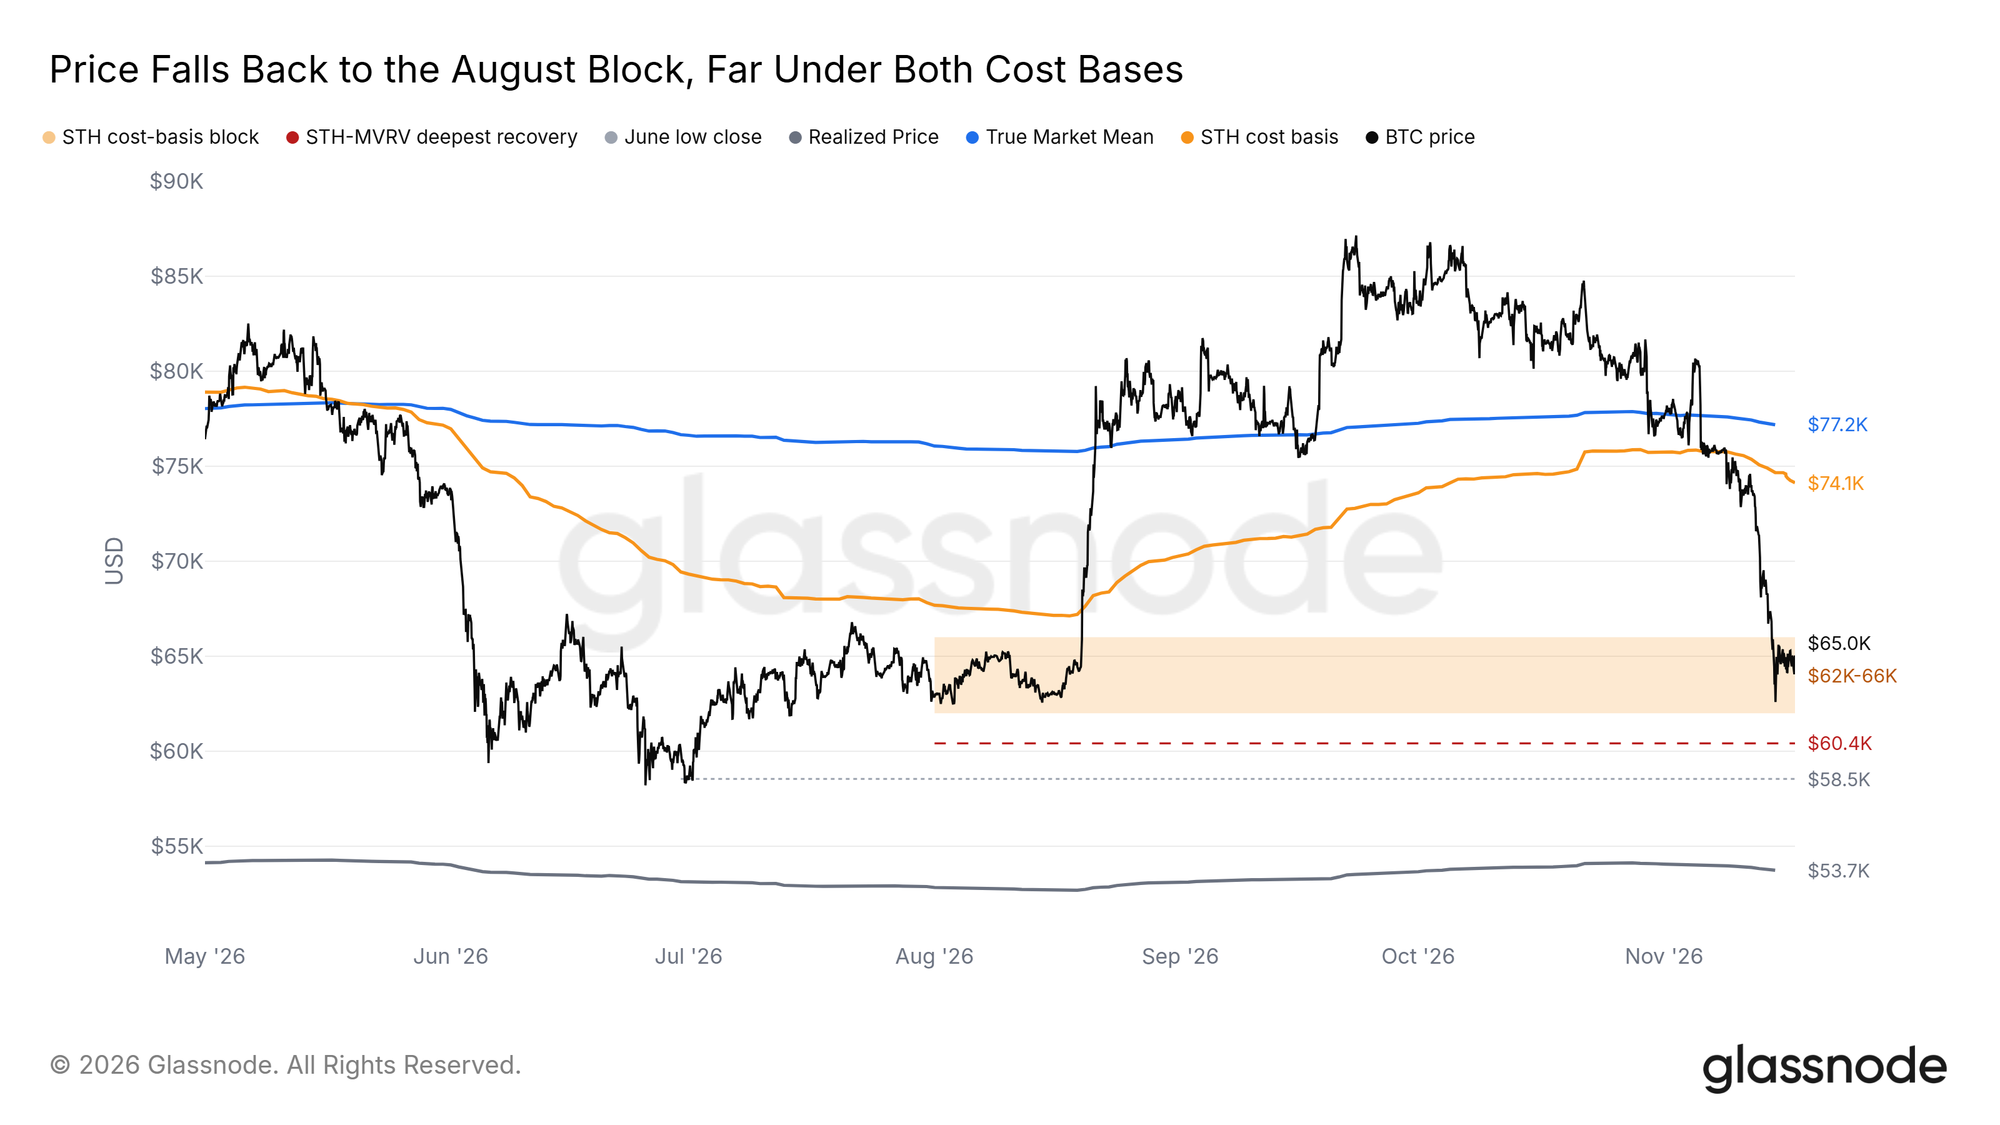
Roughly one fifth of short-term-holder supply had its estimated cost basis between $62,000 and $66,000. That band grew by around 66,000 BTC over the two heaviest selling days. The increase records coins entering that cost-basis range. Multiplying it by market price would overstate what we know about fresh outside capital.
A buyer at $64,000 is close to breakeven across much of this band. Below $62,000, the same holder faces a different decision on the next rebound. If enough holders use that rebound to exit, former support can turn into resistance. Above the band, $74,100 marks the average short-term holder’s cost basis. Sustaining a recovery through it would put a broader group of recent buyers back in profit.
05 / Glassnode
Futures liquidation levels
Glassnode · 17 Nov 2026 · 13:00 UTC
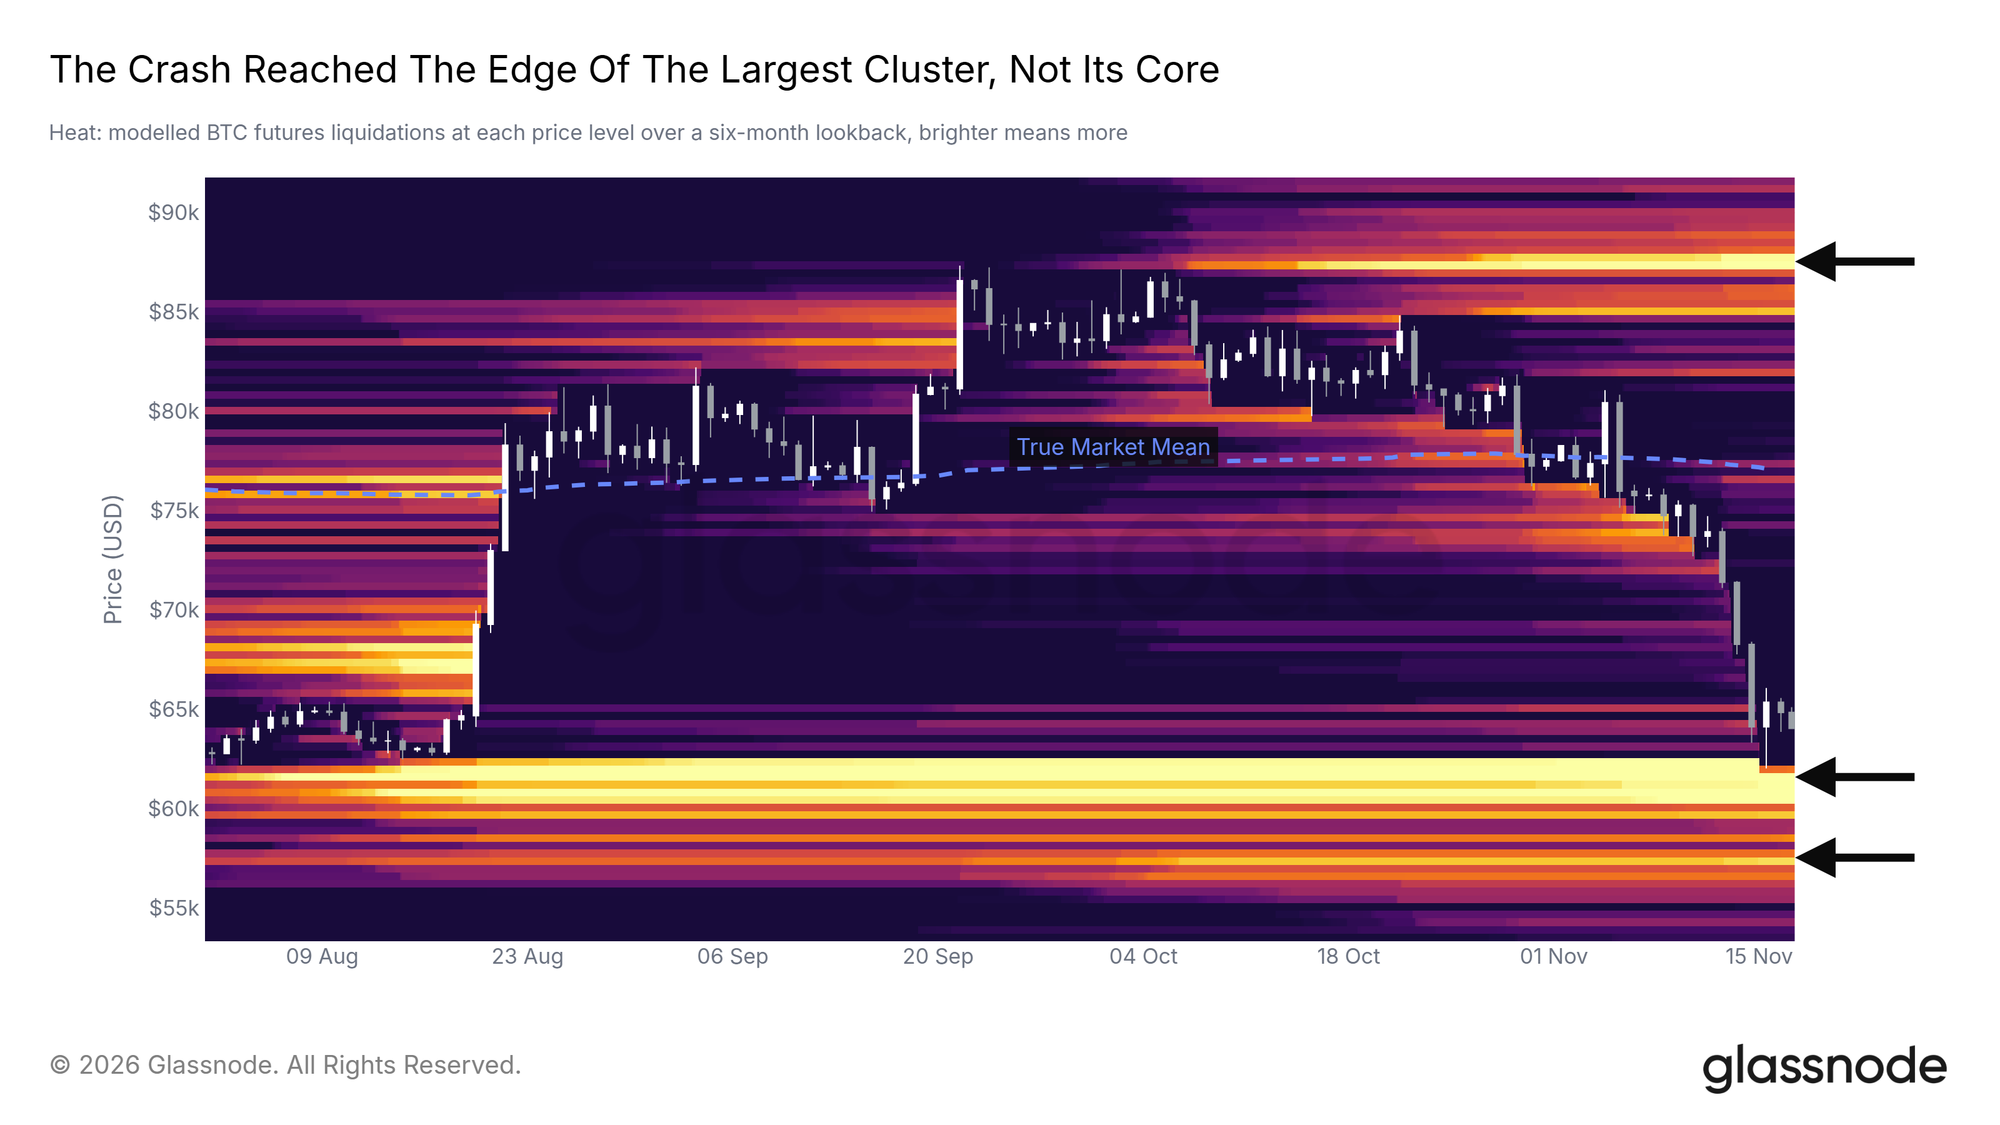
November 13 and 14 brought unusually large forced closures of long futures positions relative to open interest. Most of the modelled long exposure above $62,000 was cleared. On the way down, each forced sale added to the orders already hitting bids. Once those positions are closed, a repeat visit to the same price can produce a different result.
The remaining concentration was estimated at $59,500–$62,200. The November 15 low touched its upper edge. A slow retest with bids replenishing could absorb further selling. If bids disappear first, forced exits can push trades through several price levels quickly. Traders can also add margin or close early, so the boundaries of this zone move with positioning.
06 / Glassnode
Spot order-book depth
Glassnode · 17 Nov 2026 · 13:00 UTC
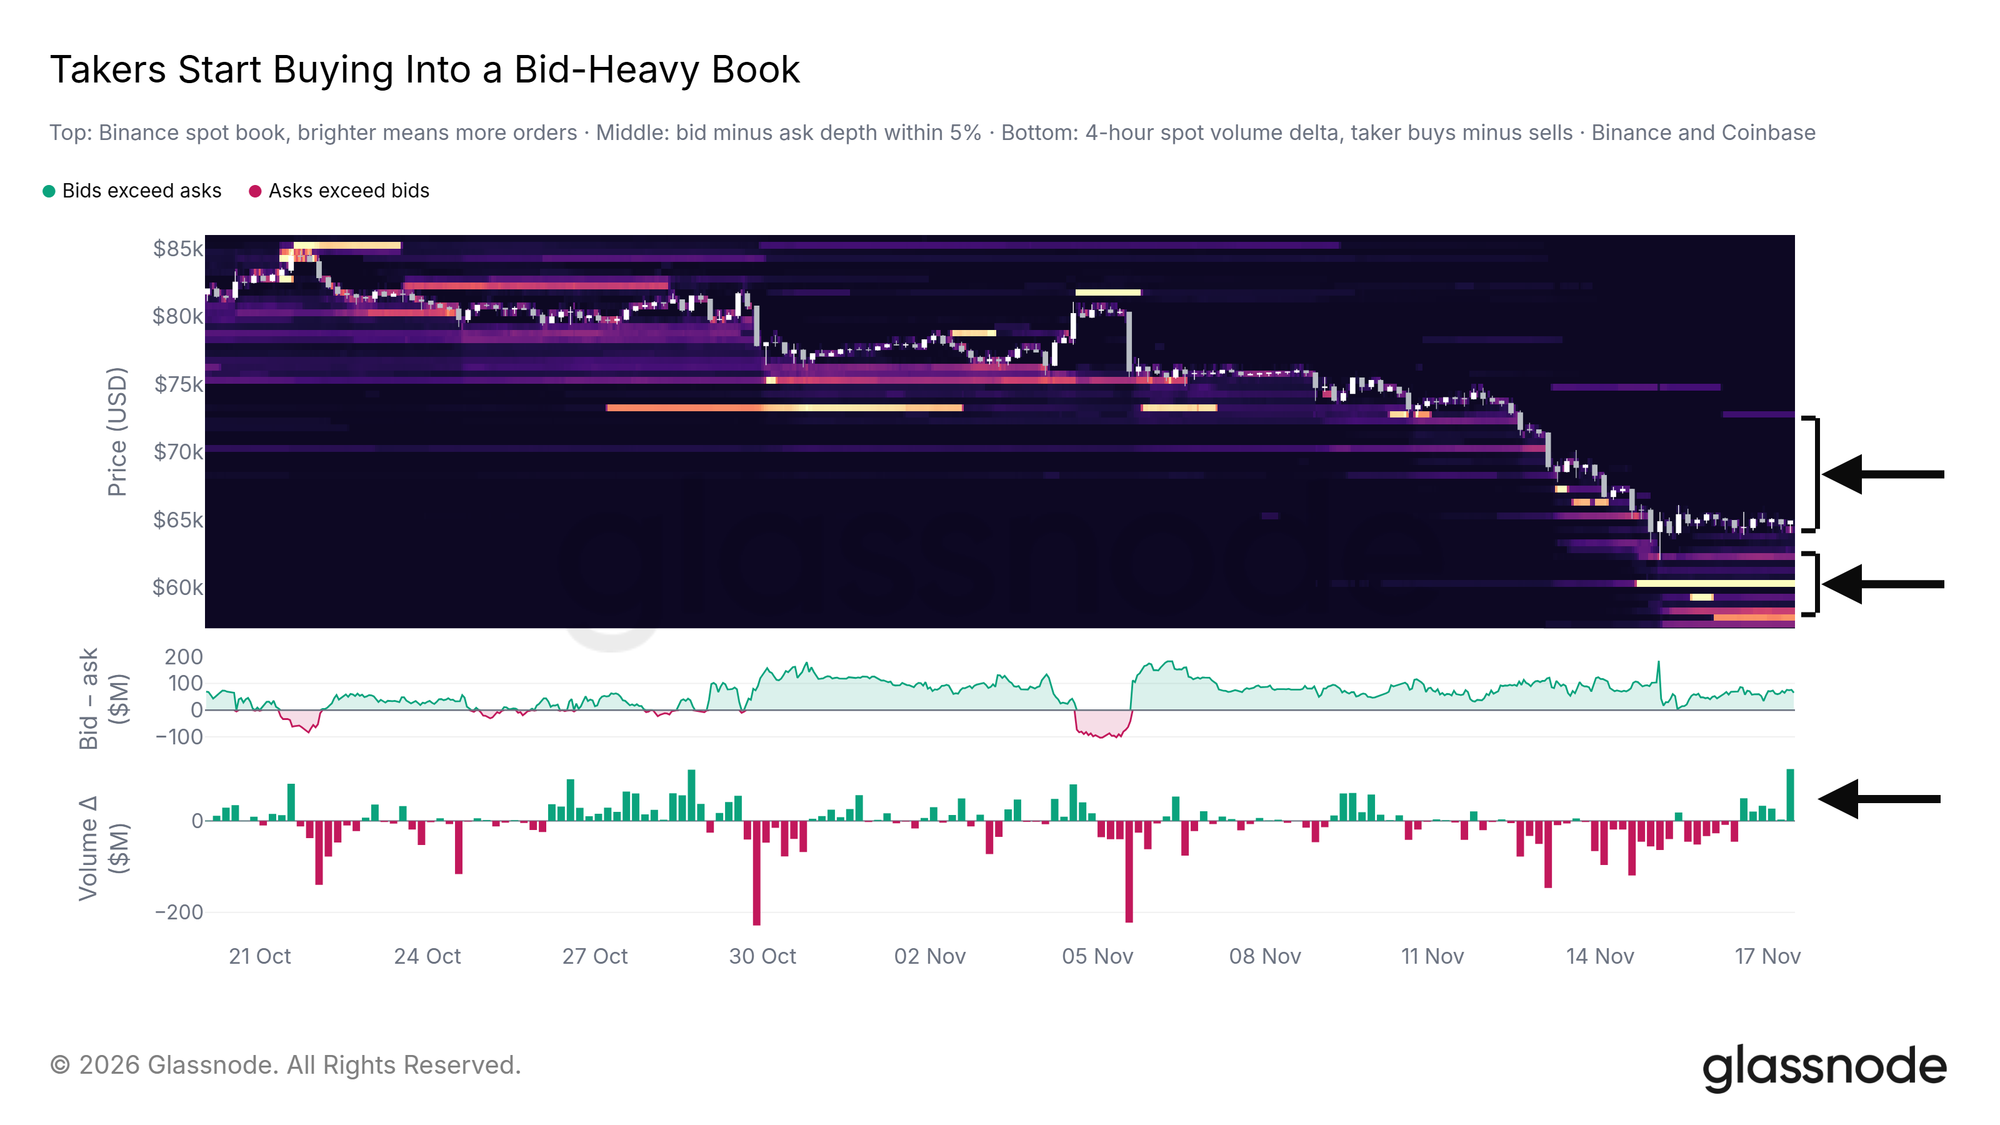
Displayed bids on Binance and Coinbase together amounted to roughly 2.3 times the offers within 5% of spot. A large concentration of bids near $60,000 on Binance gave traders a visible level to watch as futures positions were being liquidated.
A resting bid can be cancelled. Executed trades provide a second test: around the low, aggressive spot traders started buying into offers after selling into bids during the decline. On a retest, replenishment of bids after they are filled would be stronger evidence of support than a brief imbalance in the order book.
07 / Glassnode
Coinbase premium
Glassnode · 17 Nov 2026 · 13:00 UTC
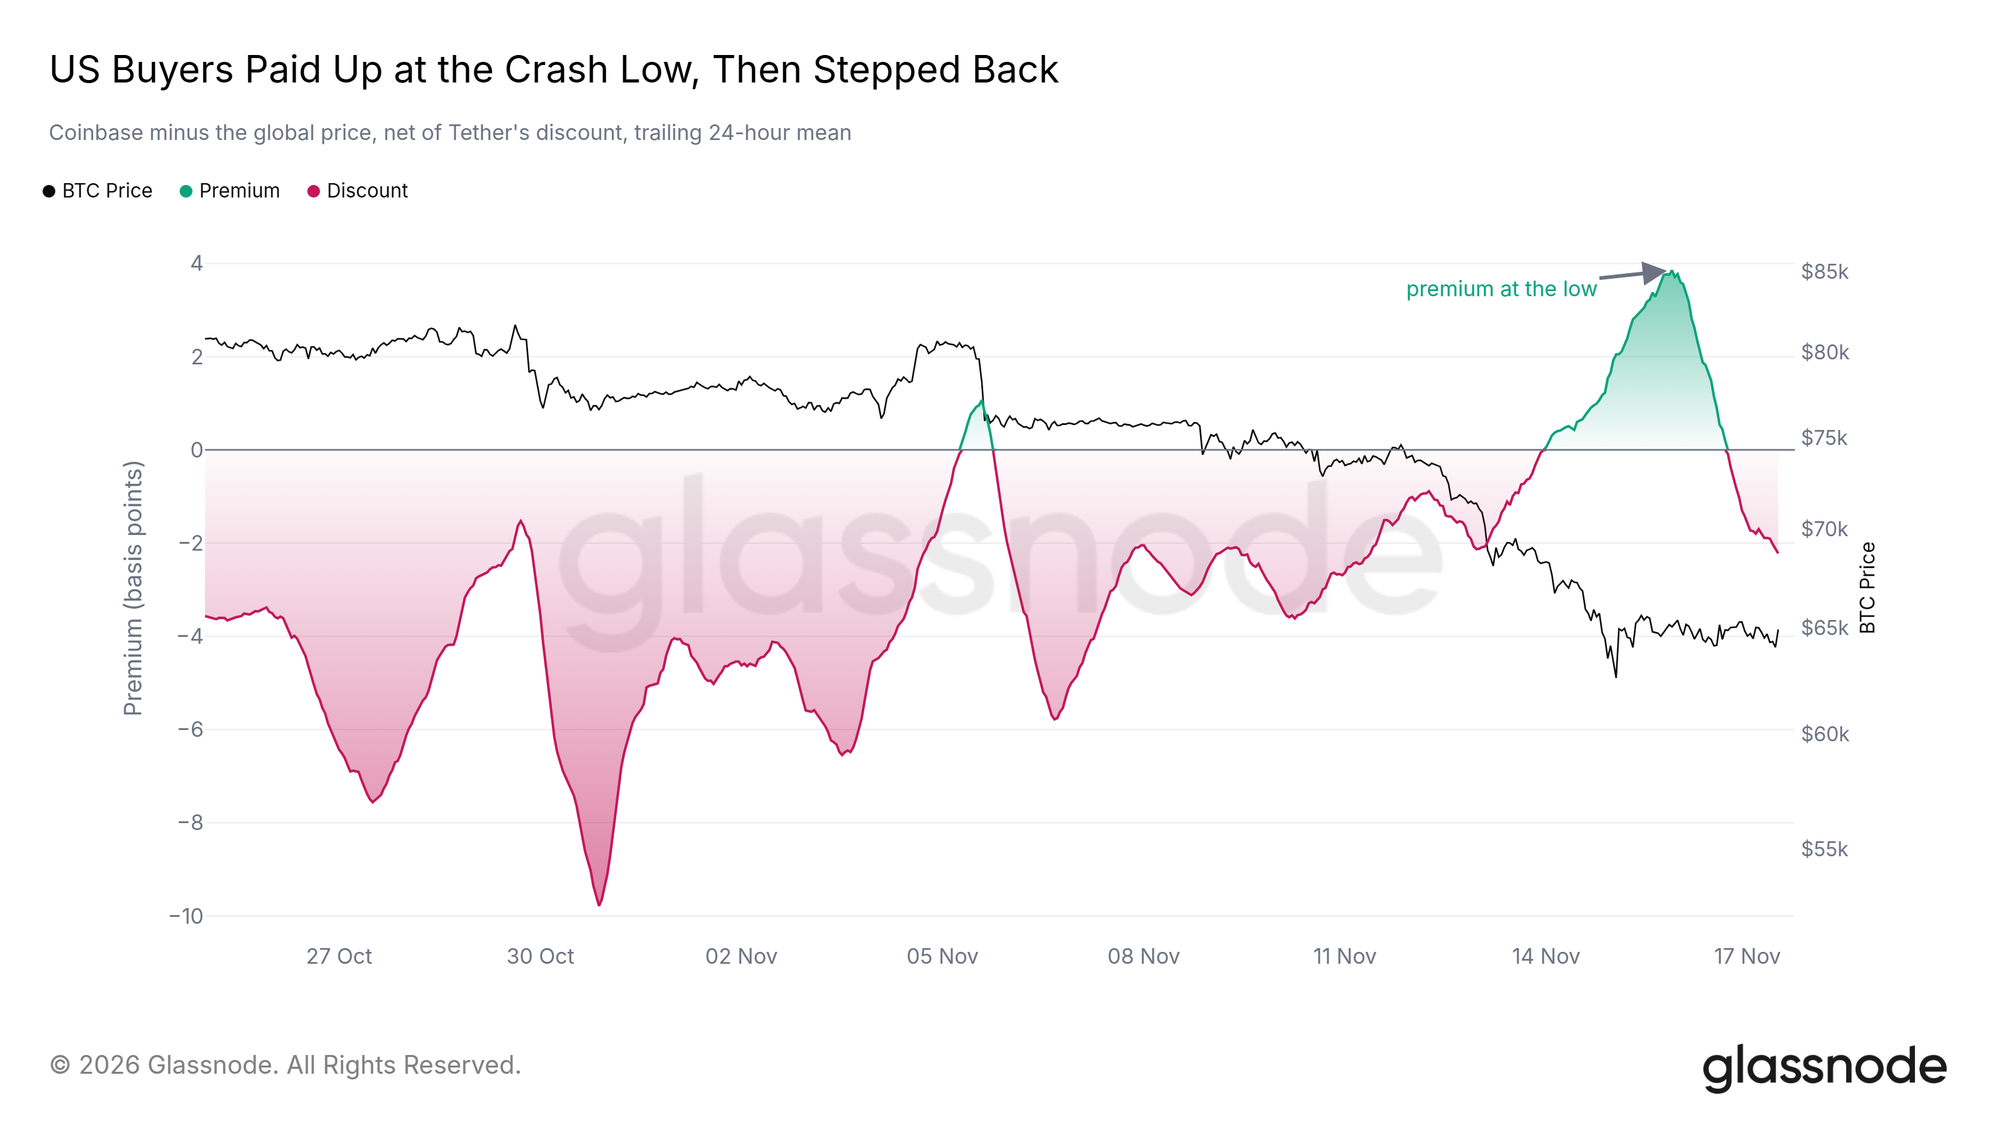
The Coinbase premium measures the difference between Bitcoin’s price on Coinbase and a global reference price. It briefly turned positive around the November 15 low. Buyers on Coinbase were willing to pay more for immediate delivery during the sharpest part of the sell-off.
By the report cutoff, Coinbase was again trading at a small discount. The buying helped absorb the initial shock. A premium that persists on ordinary trading days, particularly during a pullback, would provide better evidence of continuing demand from that venue.
08 / Glassnode
Stablecoin supply and Treasury yields
Glassnode · 17 Nov 2026 · 13:00 UTC
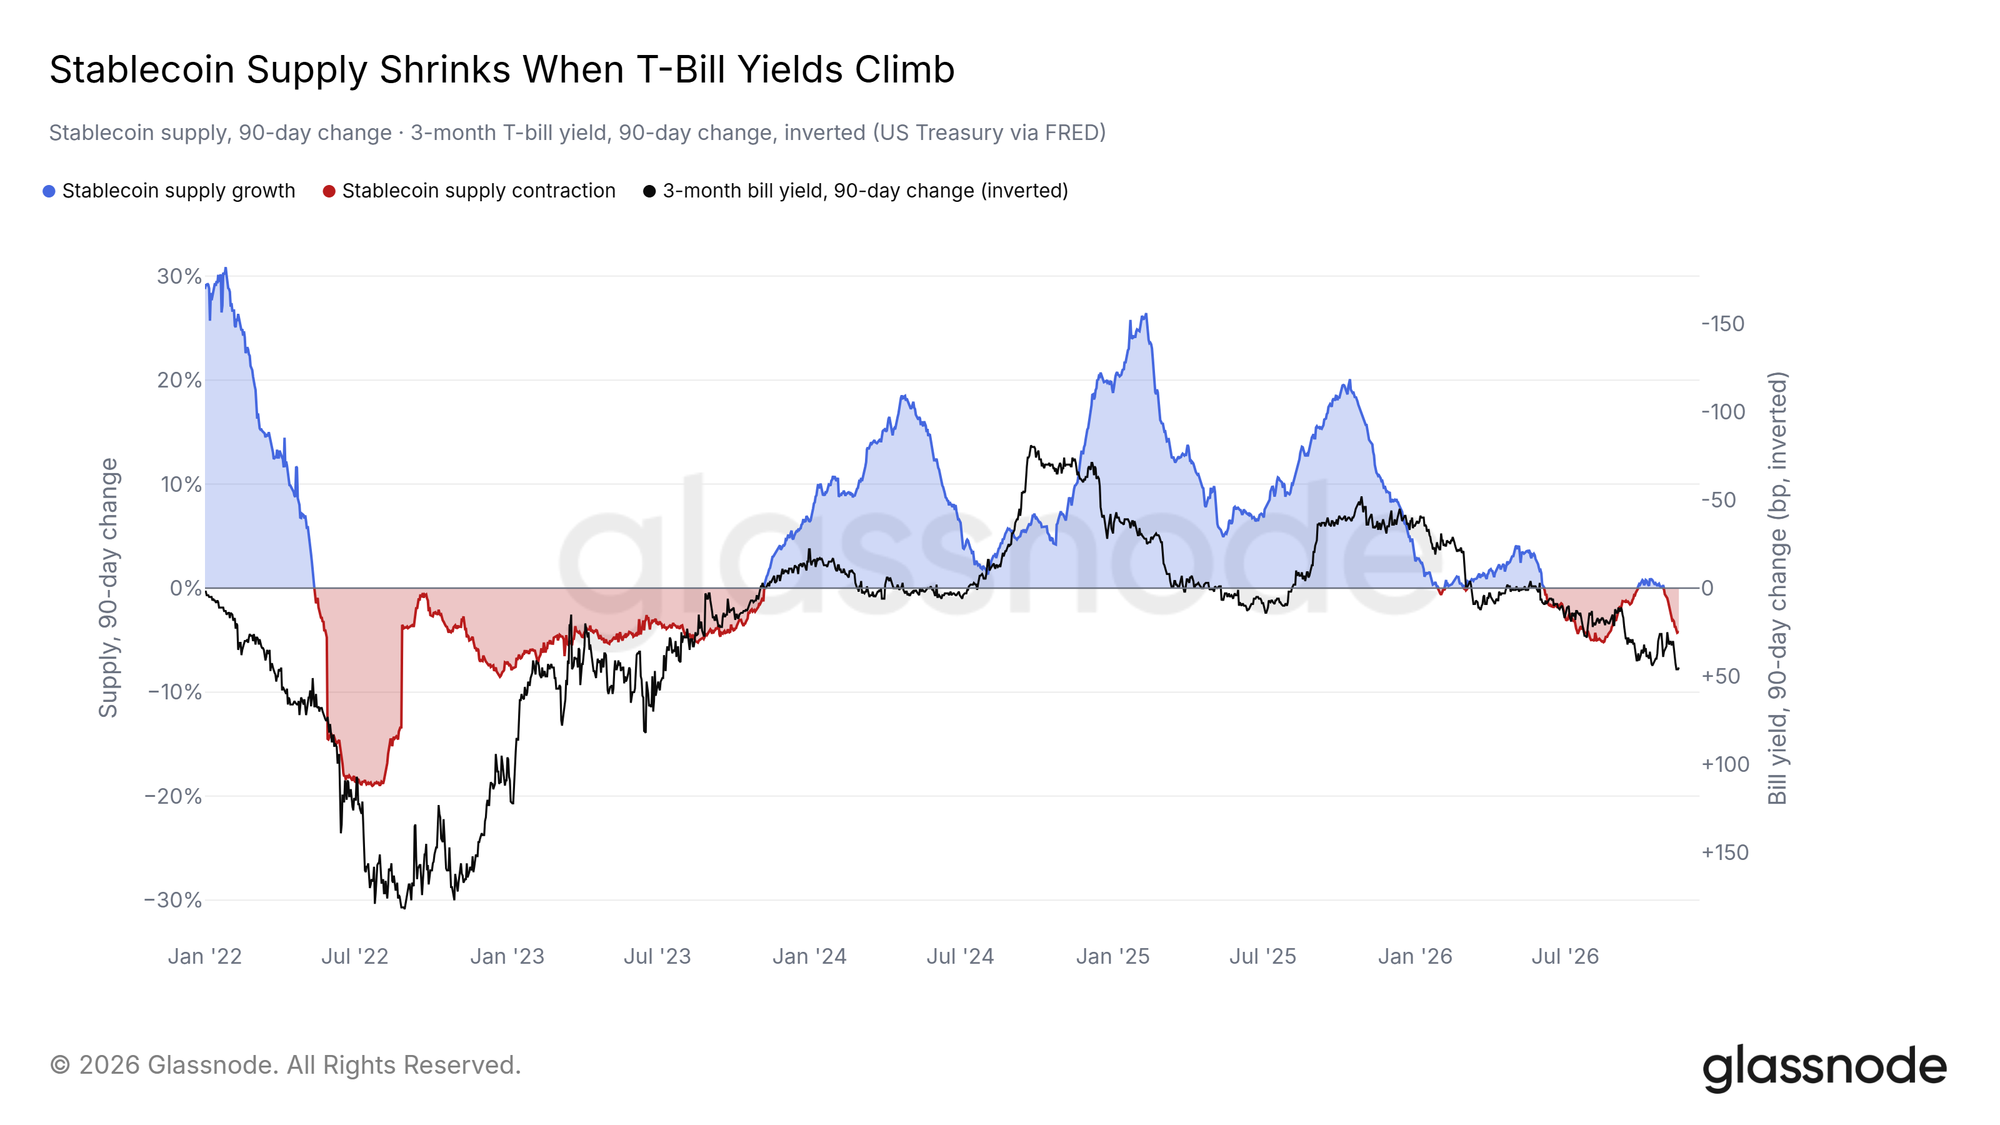
Stablecoin supply fell 4.2% over 90 days while the yield on three-month US Treasury bills rose by about 45 basis points. Investors holding a stablecoin that pays no interest face a higher cost for keeping cash available on-chain when bill yields rise.
The two changes occurred over the same period, but they measure different things. Stablecoin supply records the net result of issuance and redemptions. The Treasury yield is the market price of short-term funding. Their relationship helps explain the backdrop for crypto liquidity without tracing where each redeemed dollar went.
09 / Glassnode
Miner and corporate treasury flows
Glassnode · 17 Nov 2026 · 13:00 UTC
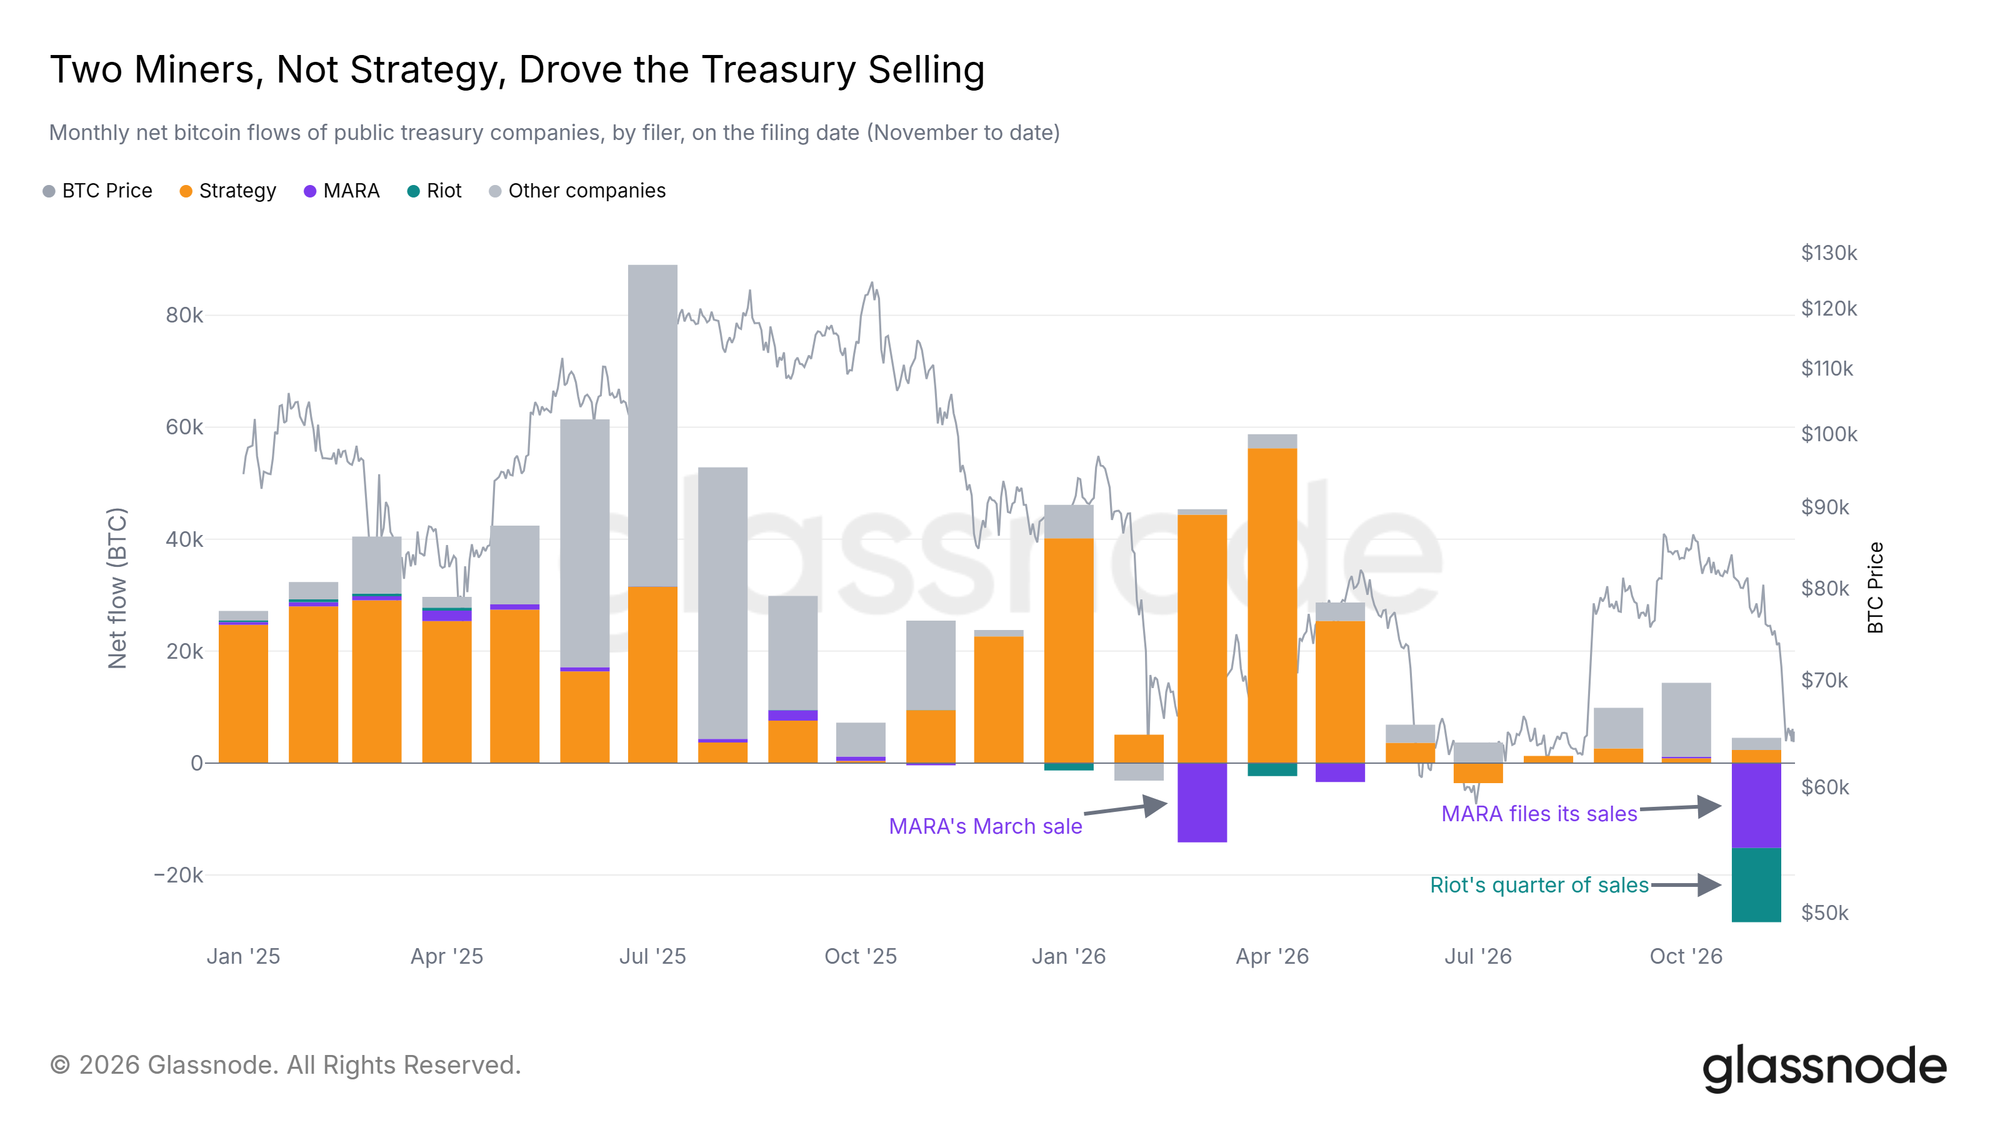
MARA and Riot together reported sales of roughly 28,000 BTC. Both miners have been investing in high-performance computing infrastructure. A company that sells Bitcoin to fund construction adds supply to the market even when its reason for selling is specific to its business.
That distinction matters when reading the corporate flow figures. Other treasury companies were net buyers outside the two miners. Separately, US spot Bitcoin ETFs recorded $2.6 billion of net outflows over the ten trading days through November 13. ETF redemptions and corporate treasury sales describe different investor groups.
10 / Glassnode
Options-implied price distribution
Glassnode · 17 Nov 2026 · 13:00 UTC
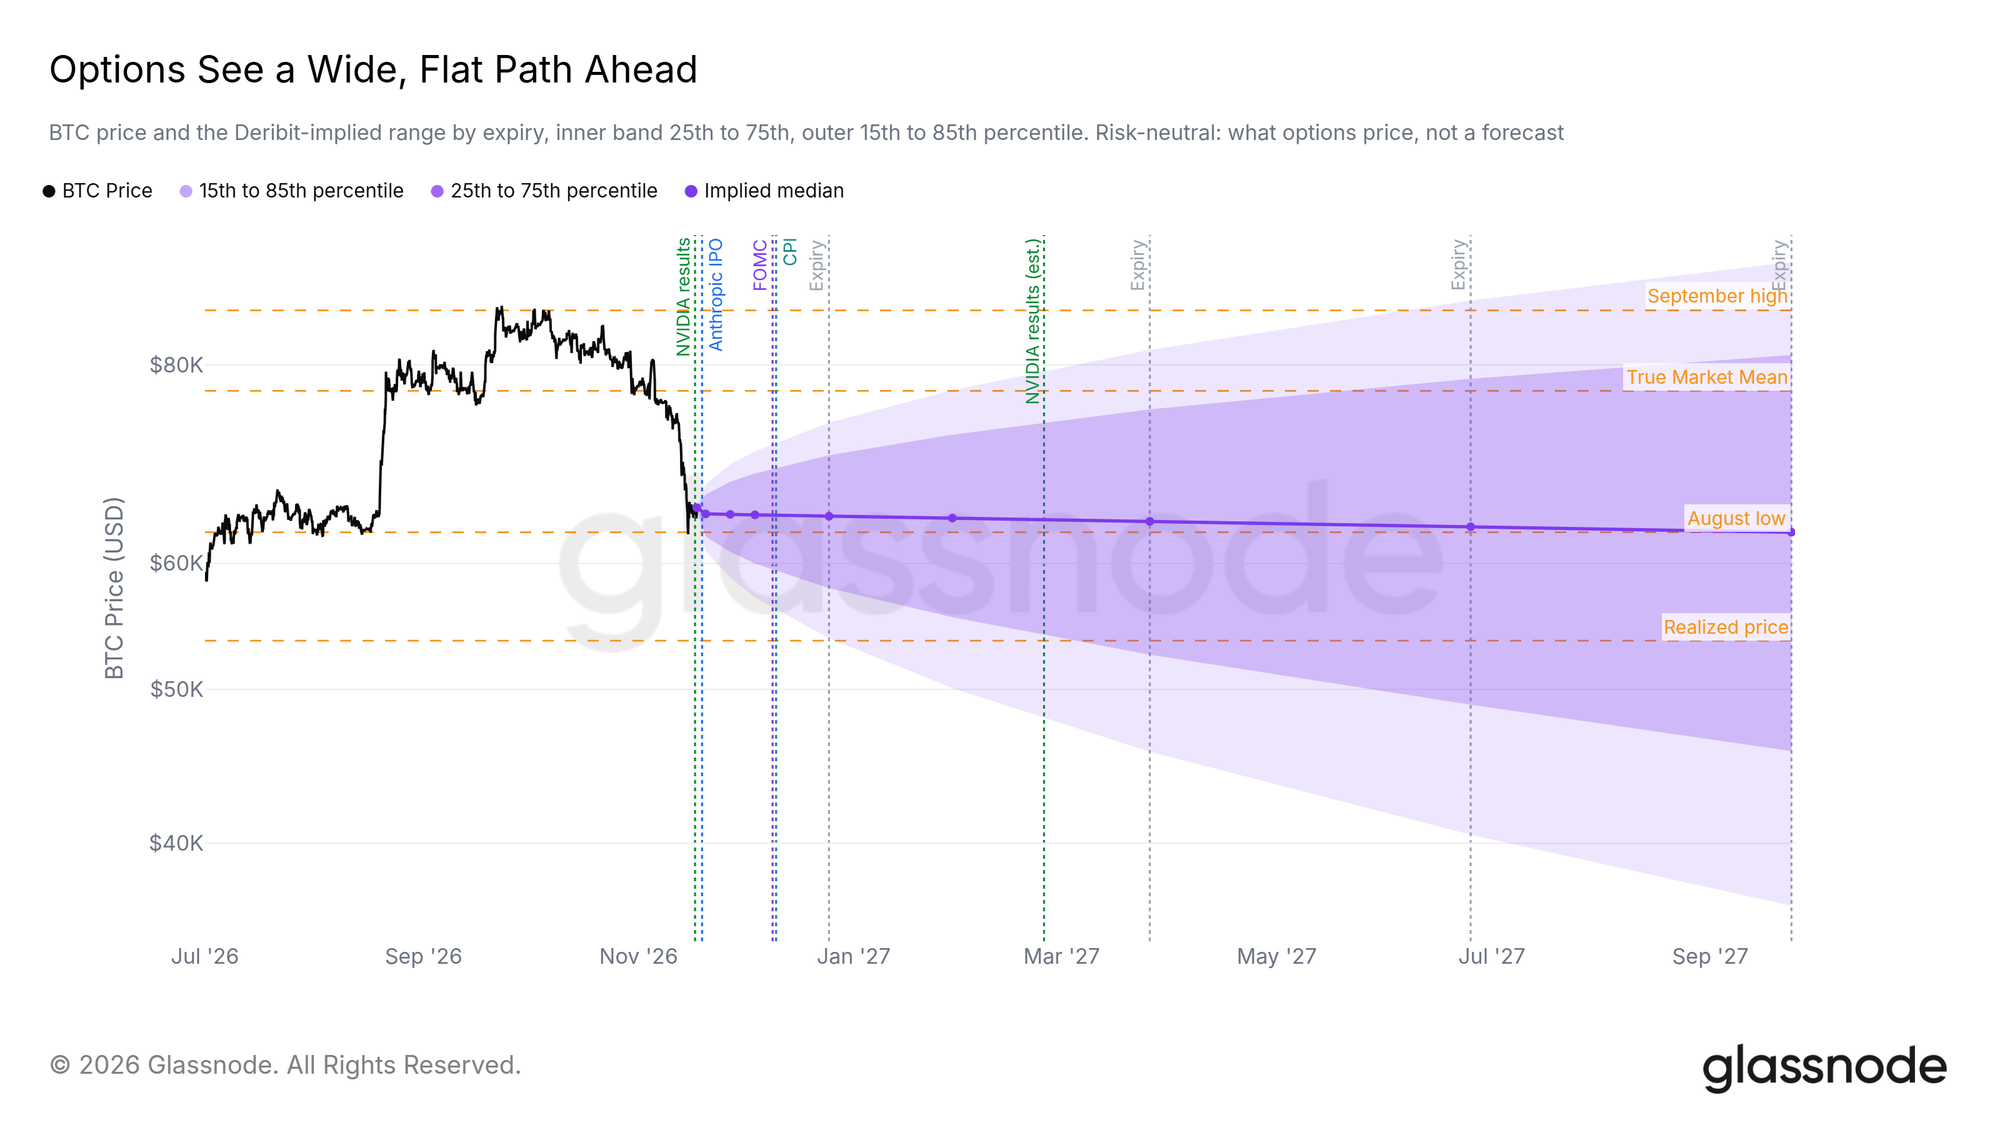
An options-implied range describes how prices at a given expiry are distributed across possible outcomes. In the November snapshot, the range widened at longer maturities even though its centre stayed close to spot. A relatively flat centre can sit alongside considerable uncertainty in both directions.
For September 2027, Deribit option prices implied about a one-in-three chance of settling below $53,700 and roughly a one-in-five chance of finishing above the September high. These are expiry estimates inferred from premiums. They can change with demand for hedges and do not measure the chance of touching either level before expiry.
11 / Glassnode
Altcoin market breadth
Glassnode · 17 Nov 2026 · 13:00 UTC
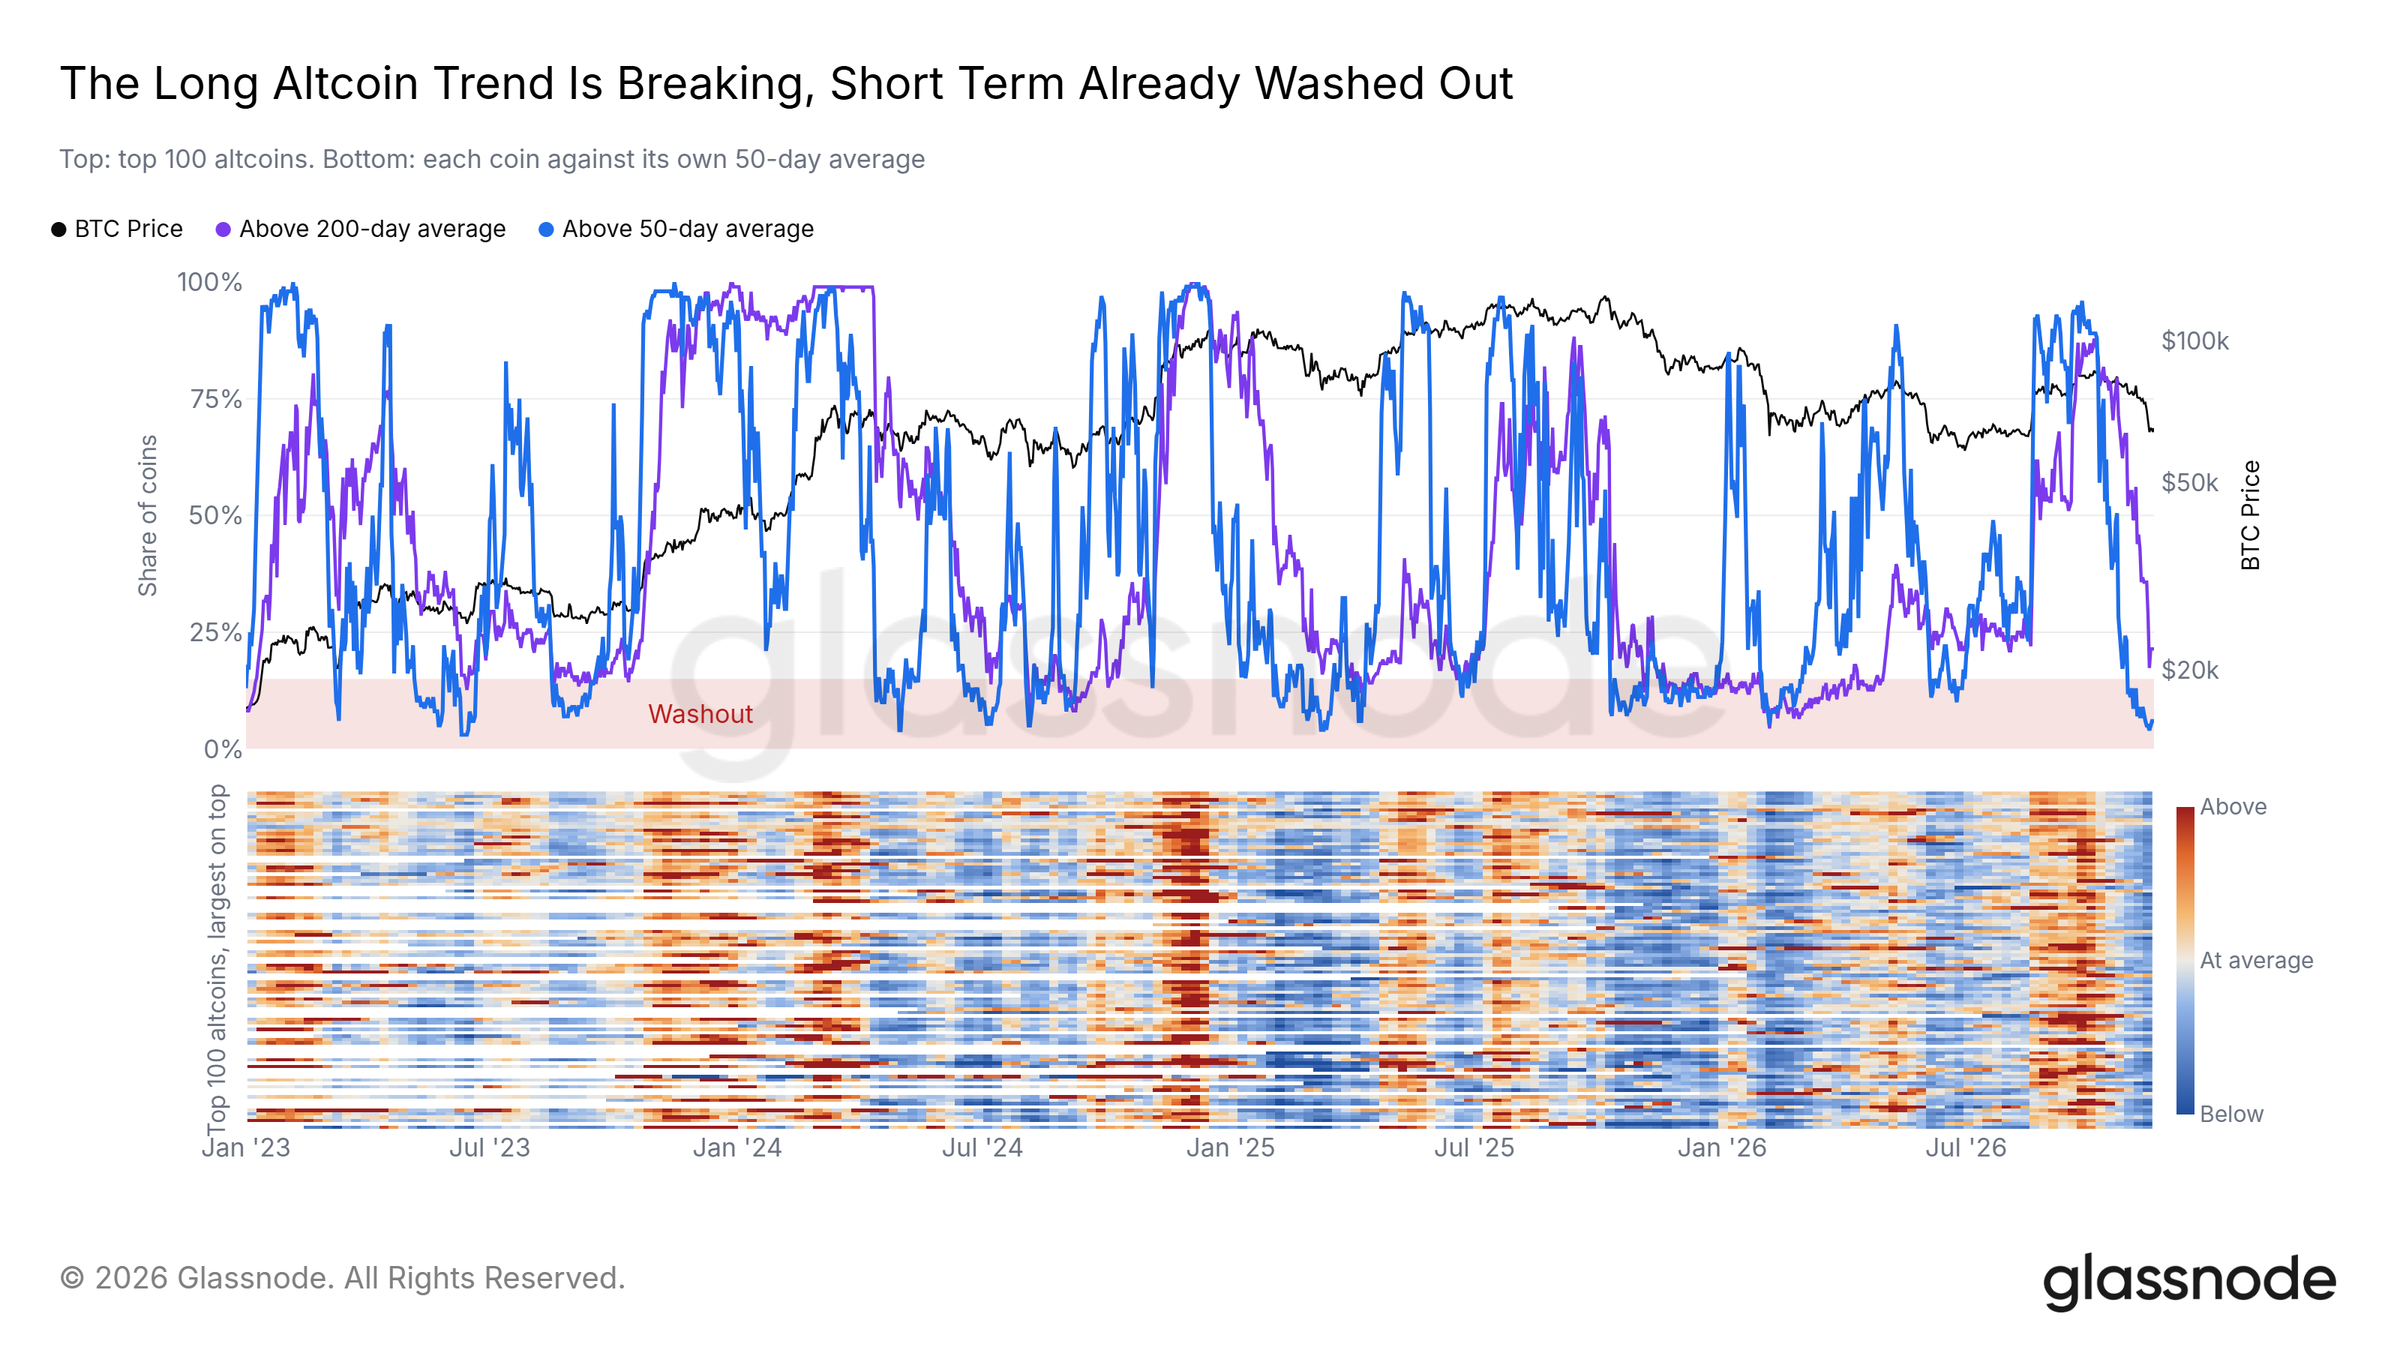
Only 6% of the 100 largest altcoins traded above their 50-day moving average. The share above its 200-day average stood at 21%. A few large tokens can lift a capitalization-weighted index while most assets keep falling. Counting how many clear the same trend measure makes that weakness visible.
The shorter average responds sooner to a rebound. If Bitcoin holds its low, a rising 50-day share would show the recovery reaching more tokens. Improvement in the 200-day share would take longer and carry a different meaning. Glassnode found past breadth extremes near local BTC lows, but the comparison covers only a few years. It gives a reason to follow participation through a rebound, not a timetable for one.
12 / Glassnode
Tokenized assets
Glassnode · 17 Nov 2026 · 13:00 UTC
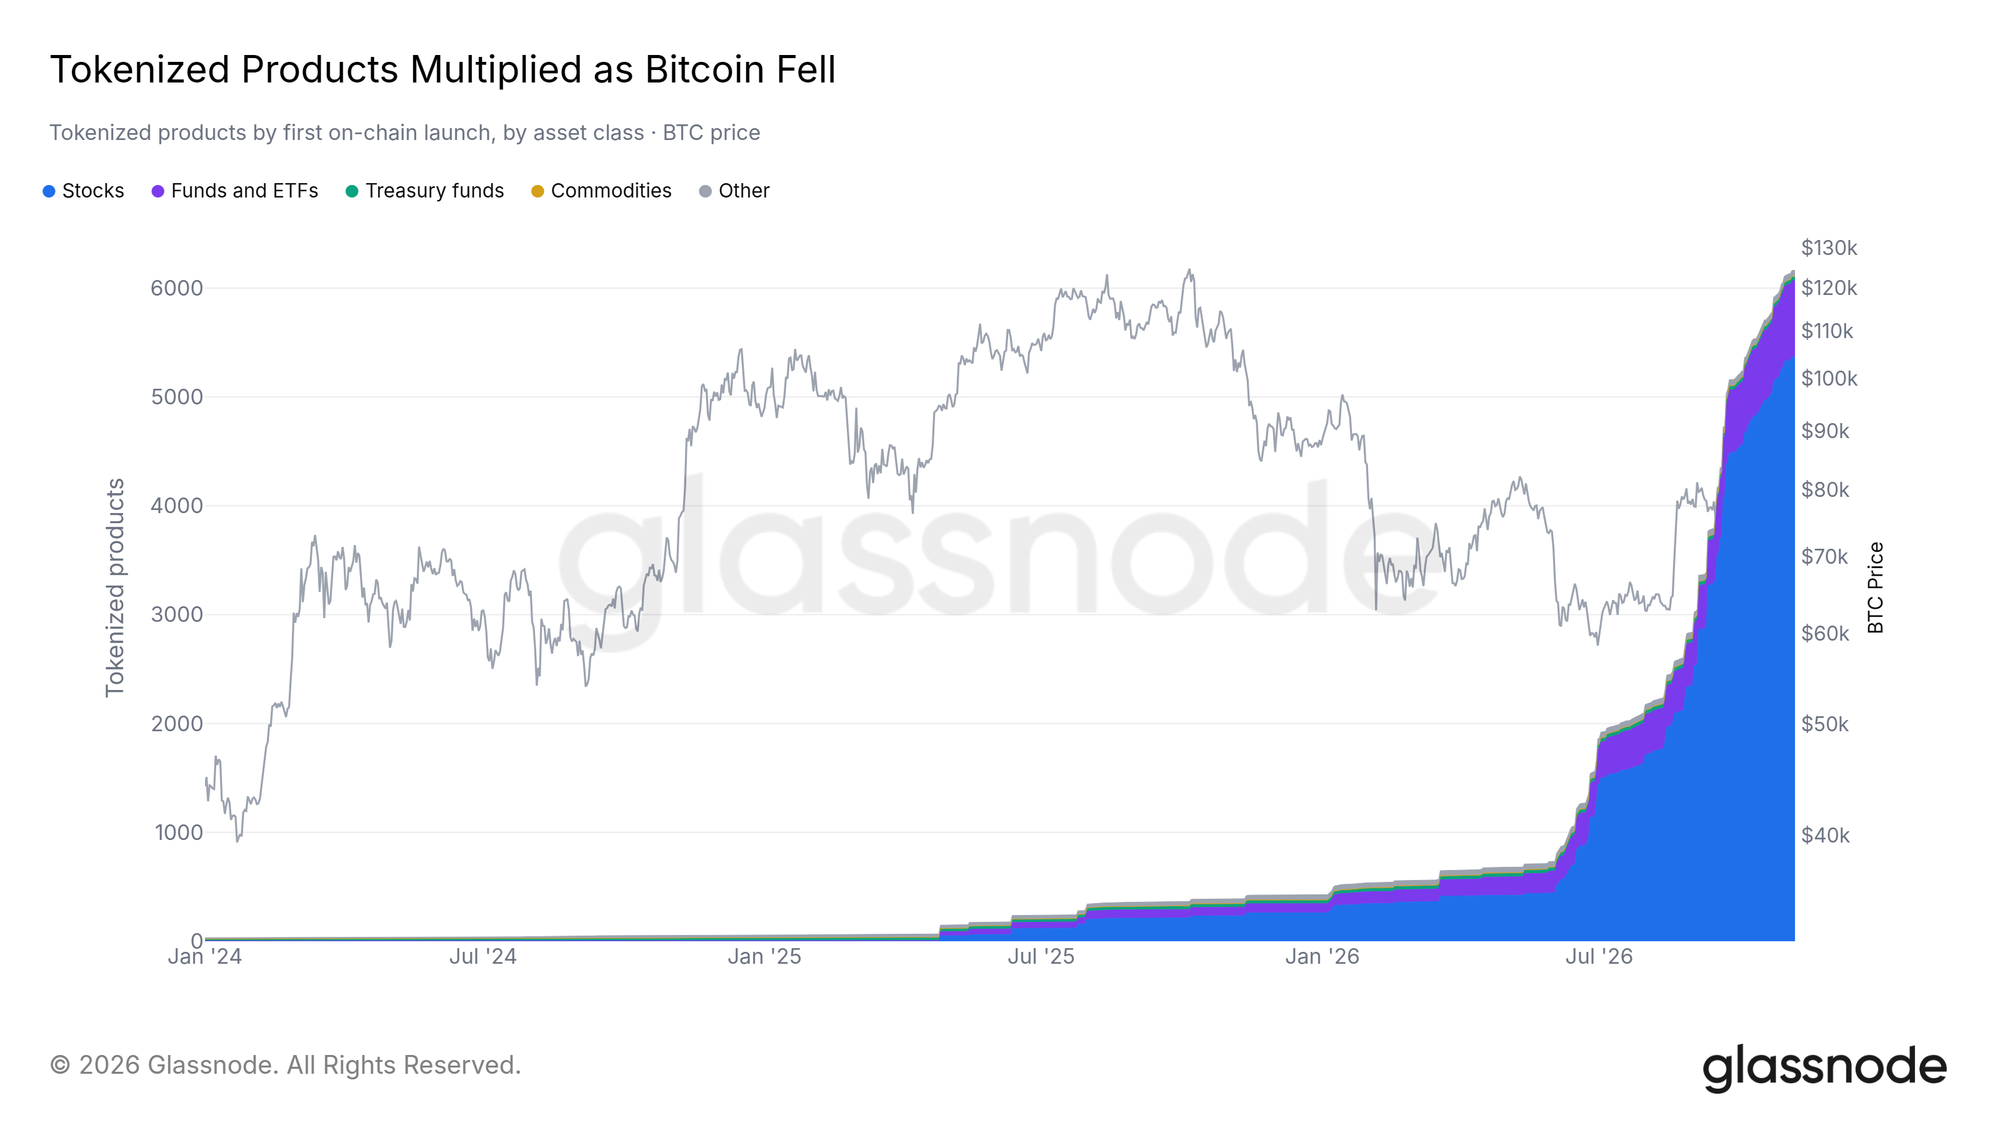
The number of live tokenized products rose from 428 at the start of the year to around 6,200 in early November. Tokenized stocks accounted for much of the expansion. Over the same interval Bitcoin fell around 15%, illustrating how issuance activity and the price of BTC can move in different directions.
Each listing adds one to the count irrespective of how much capital it attracts. A newly listed equity token and a heavily traded fund therefore carry the same weight in this chart. Turnover, outstanding value and spreads would answer the separate question of how widely investors are using these products.
13 / Sponsored research · Glassnode × Gate
RWA perpetual futures listings
Glassnode · 17 Nov 2026 · 13:00 UTC
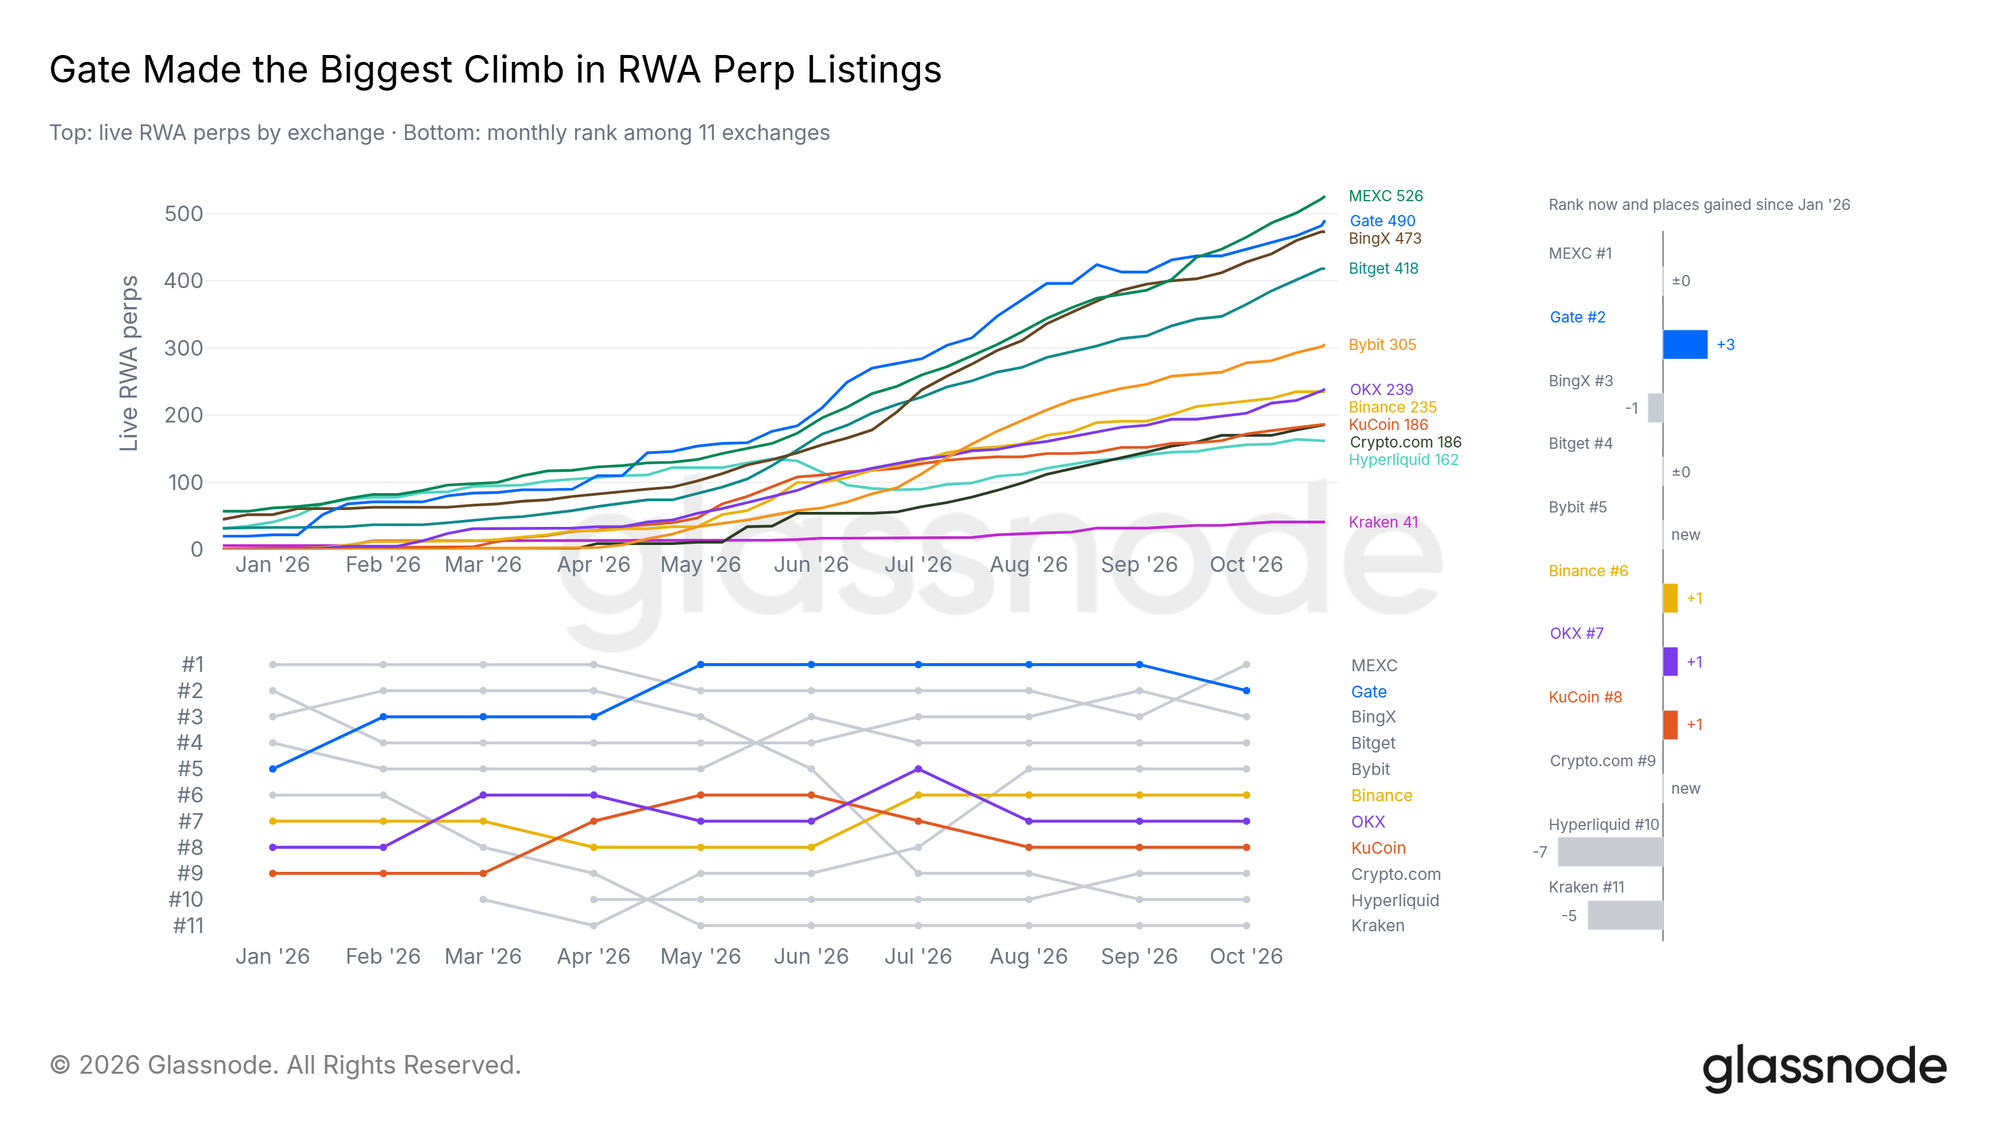
The chart ranks exchanges by the number of perpetual futures contracts they list on traditional assets such as equities, indices and commodities. In the markets tracked, the total rose from about 190 at the start of the year to more than 3,200. Gate’s own count increased from 20 to 490.
A larger catalogue gives traders more instruments to choose from. It does not tell them how easily a particular position can be opened or closed. For that, the spread, available depth and turnover of the individual contract matter more than an exchange’s rank by listings.
14 / Sponsored research · Glassnode × Gate
Open interest in RWA perpetual futures
Glassnode · 17 Nov 2026 · 13:00 UTC
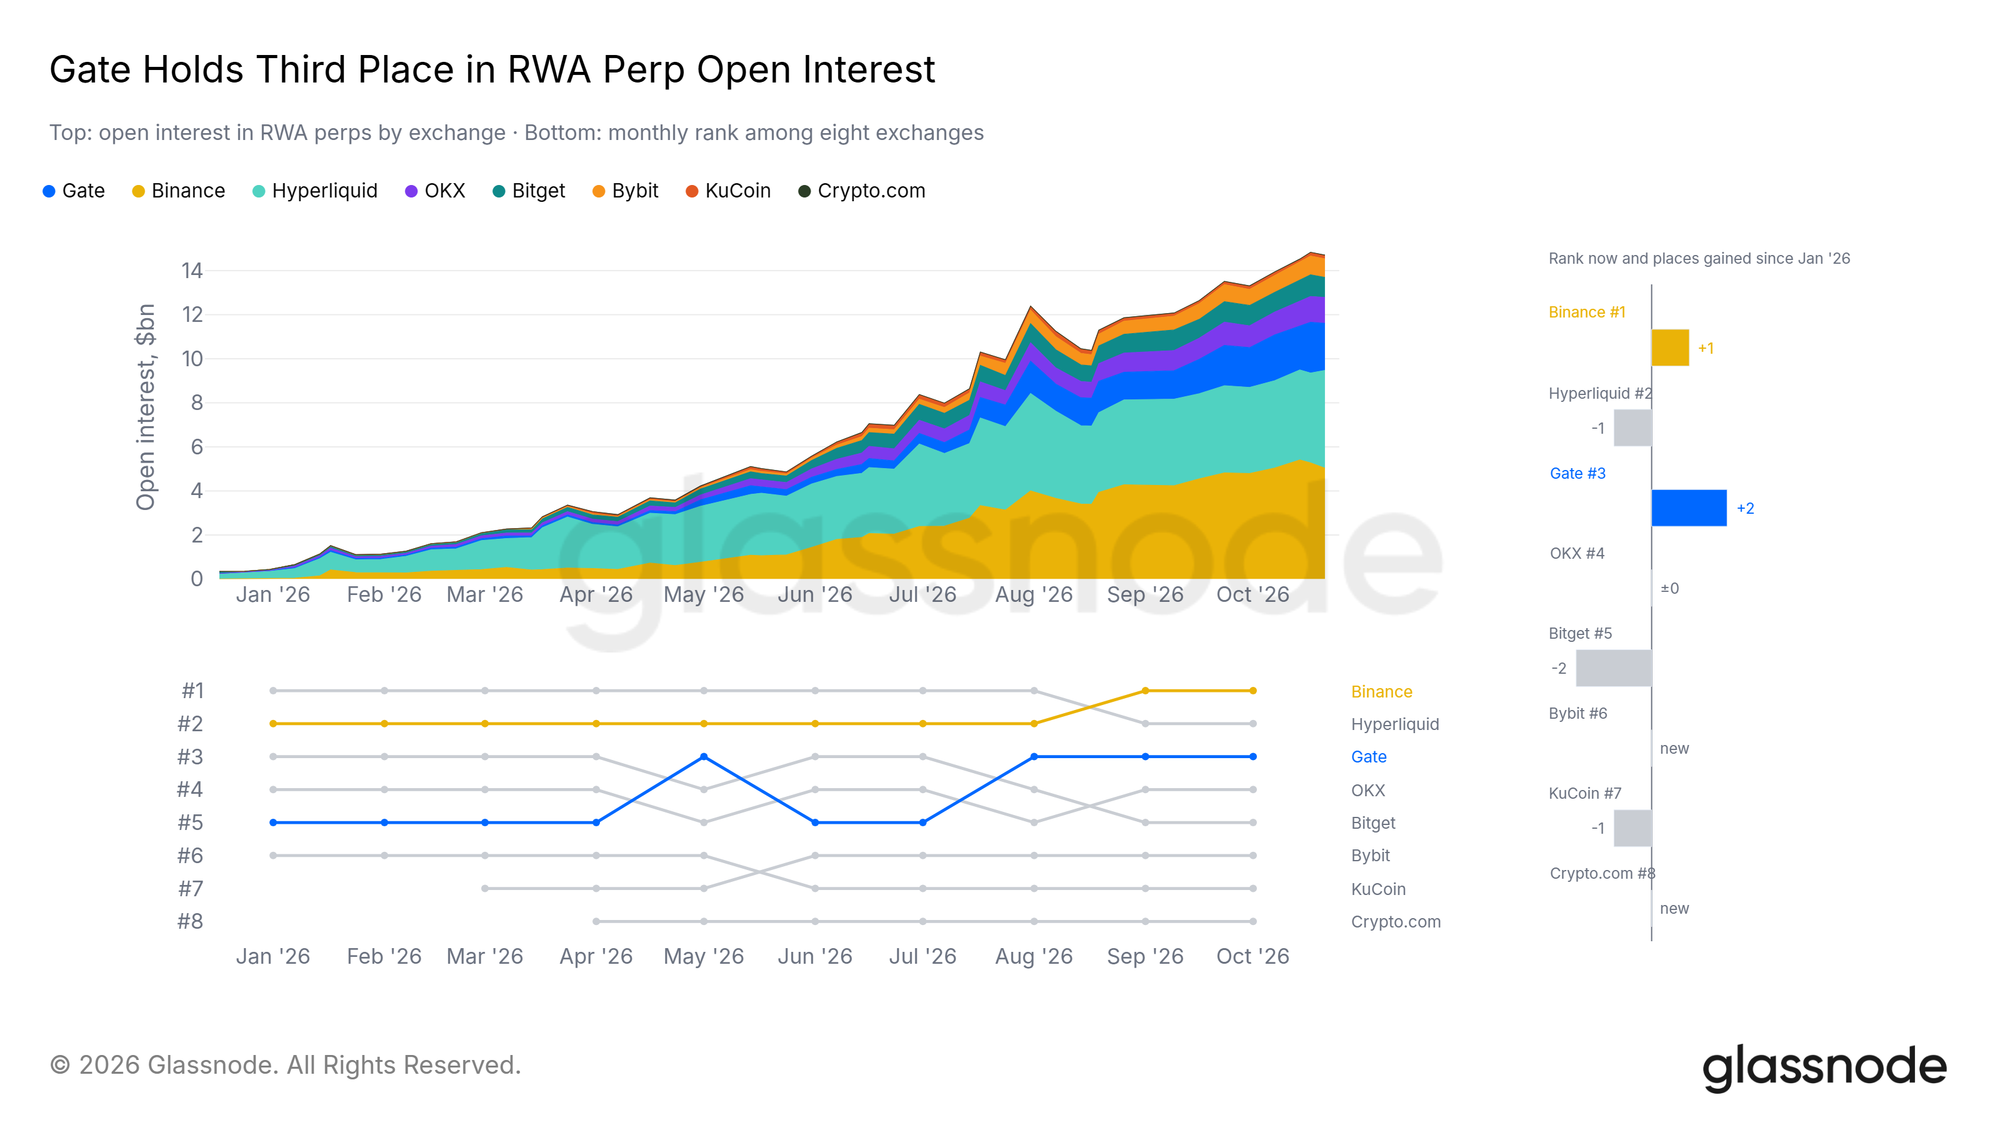
Open interest measures the value of derivatives positions still outstanding. Across the eight exchanges covered, open interest in perpetuals on traditional assets rose from about $350 million at the start of the year to around $15 billion. Gate accounted for about $2.1 billion in the snapshot.
A venue can list many contracts while traders concentrate their exposure in only a few. Reading this chart alongside the listings chart helps separate breadth of choice from actual positioning. Open interest counts outstanding exposure on contracts with a buyer and a seller, so its growth alone does not establish a bullish market view.
15 / Glassnode
Conclusion
If buyers keep absorbing sales inside $62,000–$66,000, the first hurdle is holding the upper edge on a pullback. A later recovery above $74,100, accompanied by a persistent US premium and improving ETF flows, would make a more durable low plausible. If the band holds while those demand measures stay weak, repeated crossings of $66,000 would fit a trading range. In that case, the quality of each retest matters more than the size of a one-day bounce.
A daily close below $62,000 followed by a failed recovery would weaken the case for an August floor. The remaining liquidation zone overlaps the area immediately below it. The June low near $58,500 and realized price near $53,700 then become reference levels for assessing the next reaction. The practical question at each level stays the same: once forced selling subsides, will spot buyers continue to absorb supply?
#BTC #Glassnode #on-chain analysis #liquidity #altcoins




No comments yet
Be the first to share your perspective.