TOTAL CAPITULATION

PUBLISHED: 2026-11-20
CATEGORY: onChain Analysis
As Bitcoin fell toward $64,000 in mid-November 2026, nearly 80% of its on-chain cost basis was underwater. Using On-Chain Mind’s original charts, this article follows the losses from recent buyers and holders of one- to two-year-old coins to the futures exchanges that closed leveraged longs.
The video’s sentiment gauges, Omega Score and historical return comparisons offer several ways to read that sell-off. Each chart is paired with an explanation of its scale, the period it covers and what it can tell an investor about the months and years ahead.
01 / Executive summary
What the November sell-off revealed
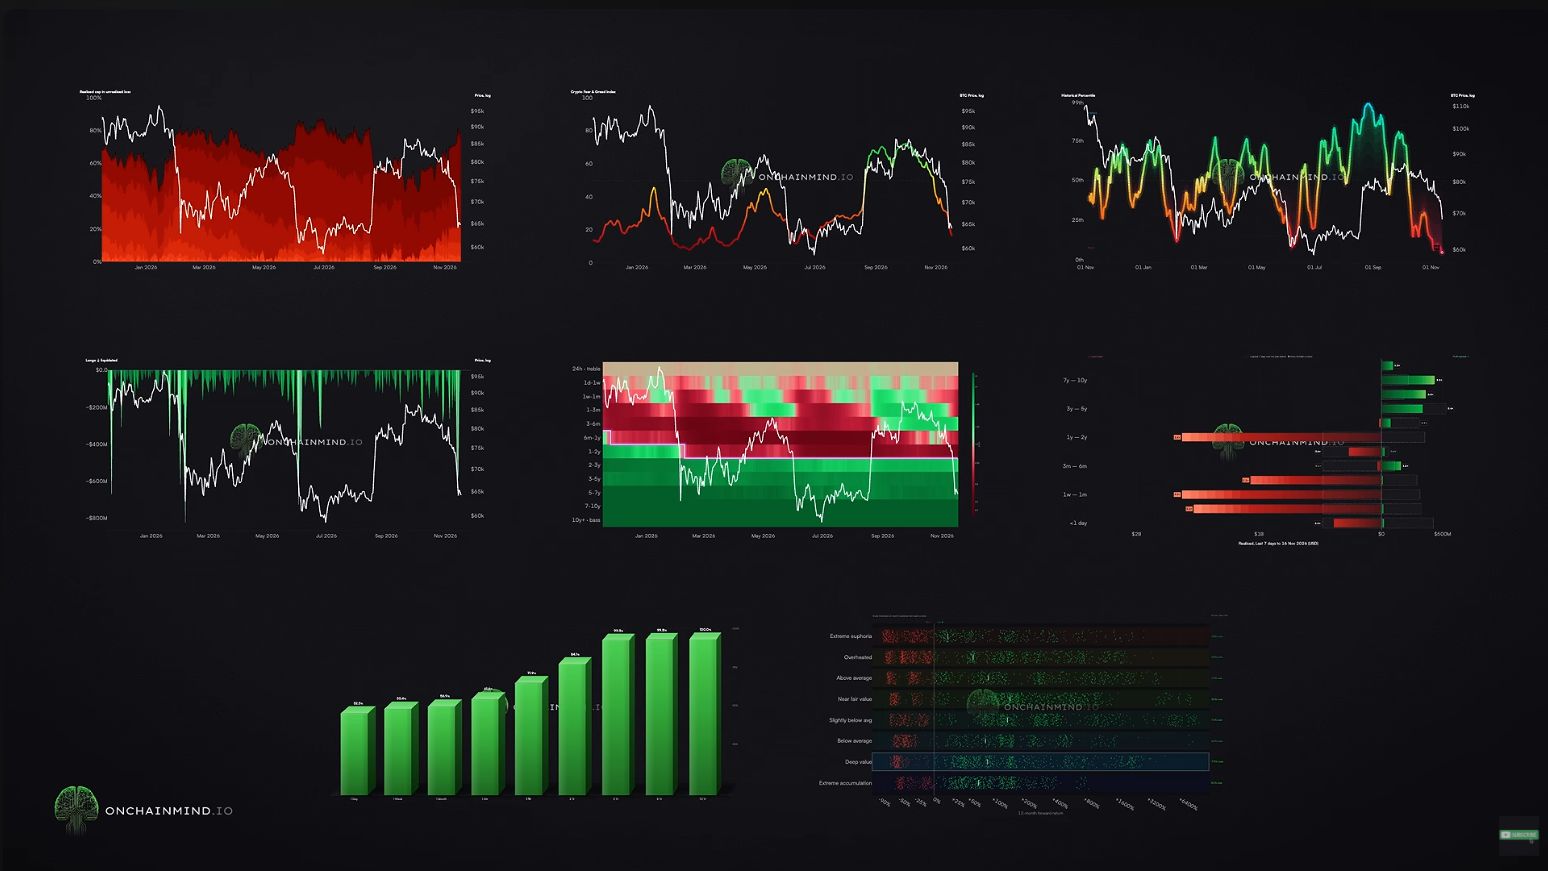
Nearly four out of five dollars of Bitcoin’s estimated on-chain cost basis sat above the market price. Yet the people taking the largest losses were concentrated in two groups. Recent buyers were unwinding the rally, and some coins held for one to two years moved at a steep loss. Coins held for more than three years were still moving at a profit.
The futures market added urgency. Exchanges liquidated about $1.8 billion of Bitcoin longs over the week as sentiment returned to levels last seen around the June low. On-Chain Mind reads this combination as capitulation. Its historical charts also show why someone with a two-year horizon could find the same market attractive while a short-term buyer still faced substantial downside.
02 / Capital at a loss
How nearly 80% of Bitcoin’s cost basis went underwater
June, September and back again
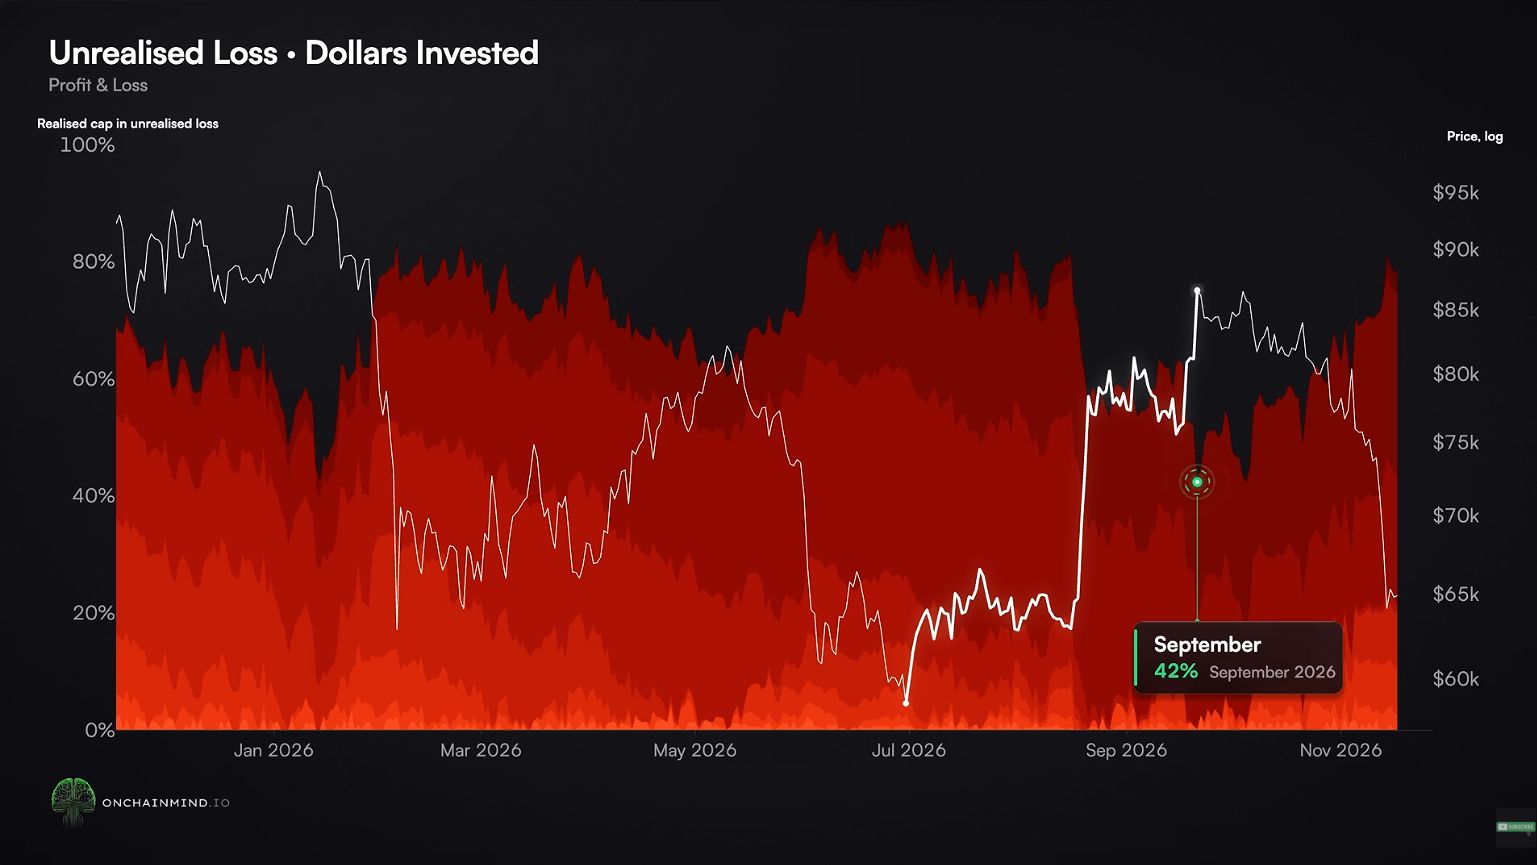
Realized capitalization values each coin at the dollar price when it last moved. The red area adds up the cost basis of coins whose last-move price exceeds the market price, then divides by total realized capitalization. A coin last moved at $90,000 carries three times the weight of one last moved at $30,000. Transfers between a holder’s own wallets can reset that reference price.
At the June 30 close near $58,600, the underwater share reached 87%. The rally into the mid-$80,000s brought it down to 42% in September. Within roughly two months it was back near 80%. That describes how much cost basis was underwater. An individual buyer’s percentage loss could be much smaller.
What past lows looked like
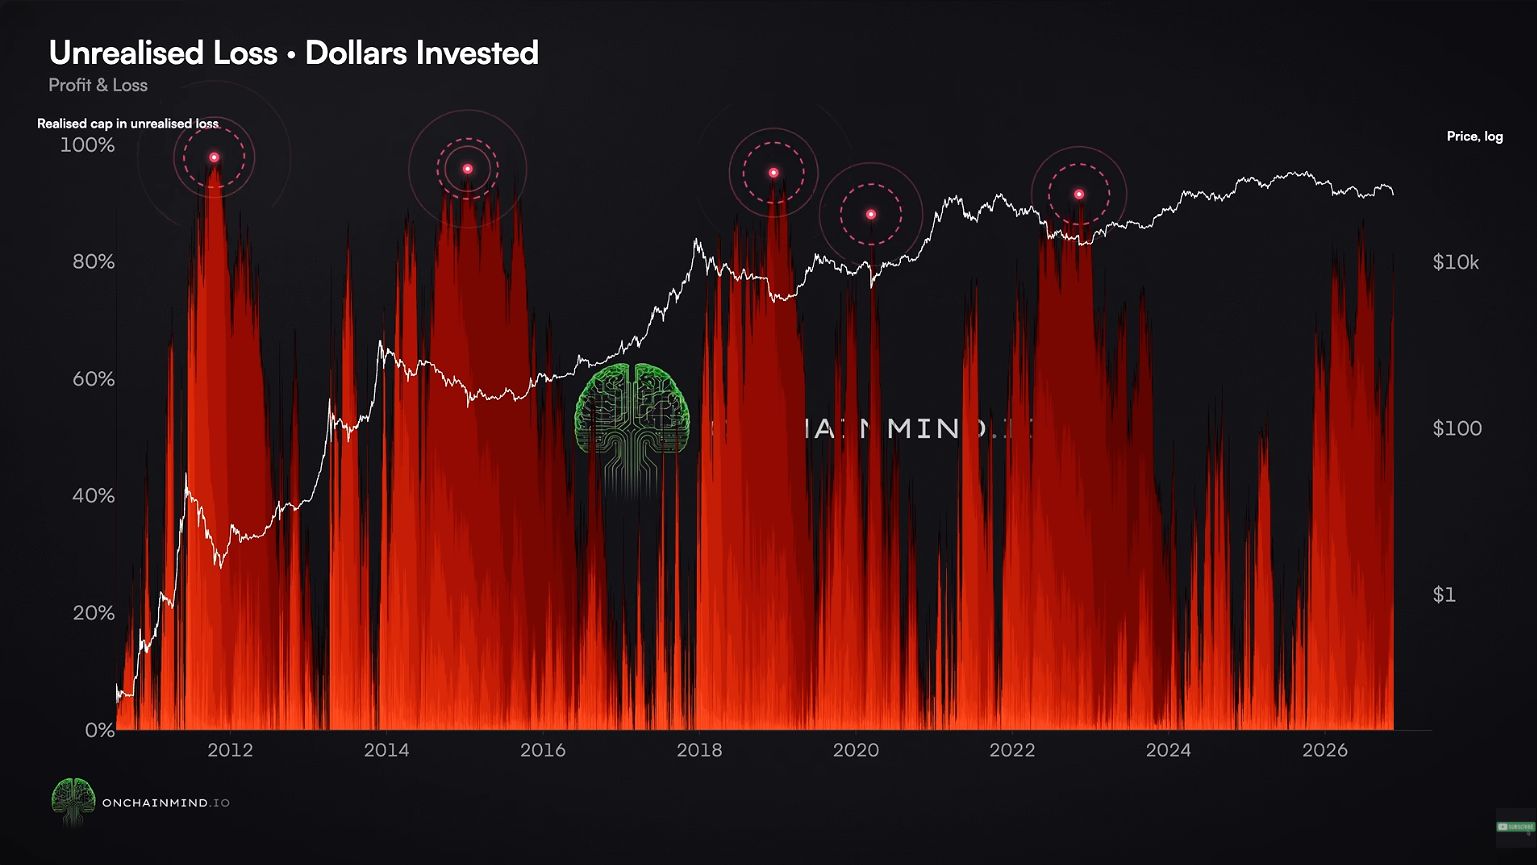
On-Chain Mind puts the share near 98% in 2011, 96% in early 2015, 95% in late 2018, 88% in March 2020 and 92% in November 2022. The November 2026 reading was unusually severe, though every marked episode went further.
The narrator says fewer than one in five historical days registered more stress. The early peaks also came when the network had less capital acquired at very low prices. That changing mix makes a fixed threshold such as 95% a poor requirement for recognizing a later cycle low.
03 / Cost basis
Why a recovery toward $81,600 could draw sellers
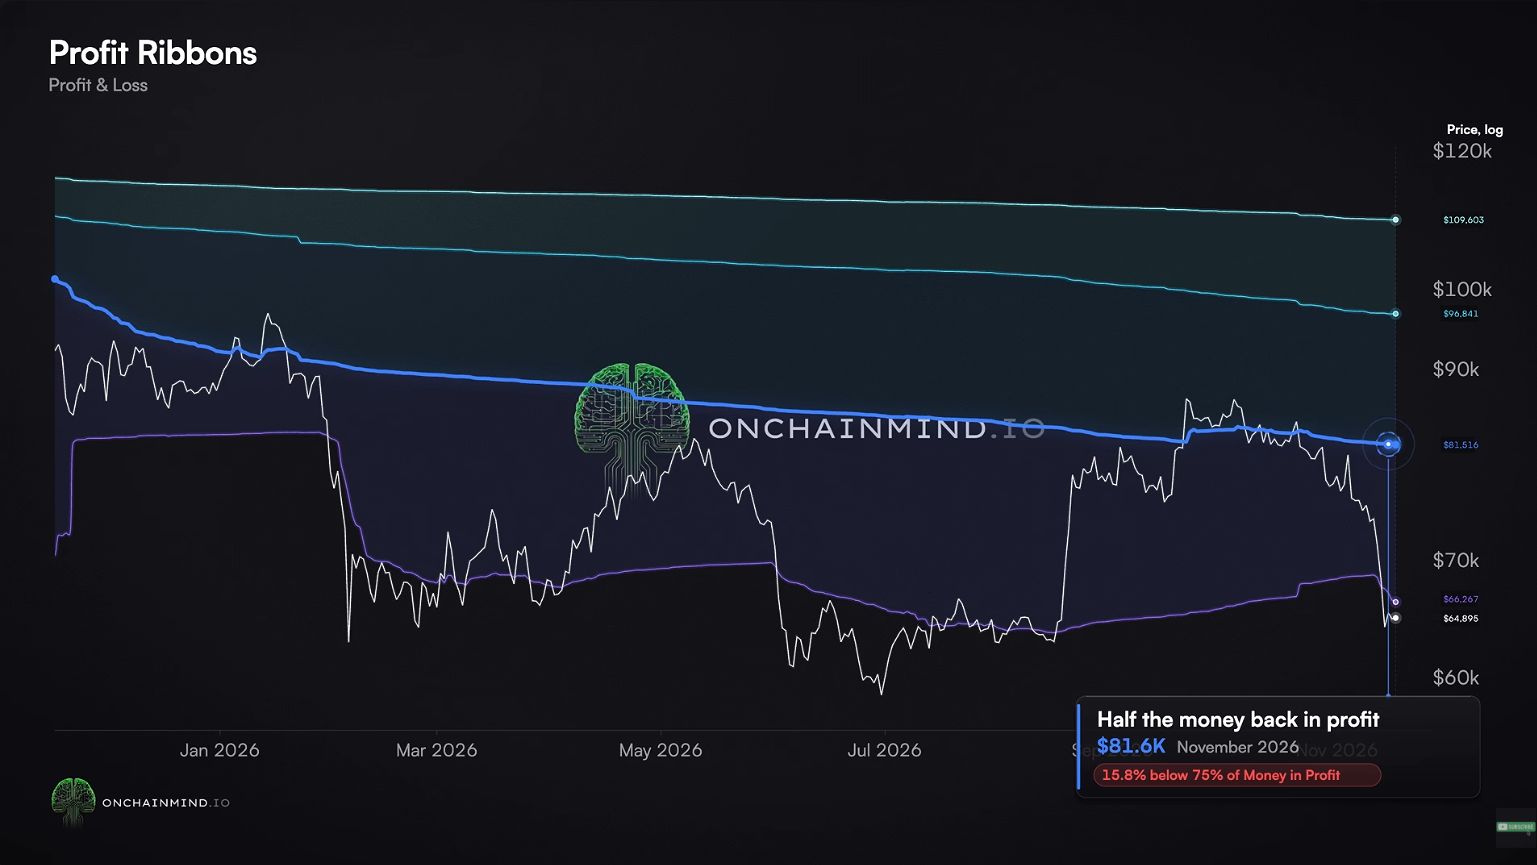
The profit ribbons turn the underwater share into a price level. At the time of the video, the middle ribbon was around $81,600. If the cost-basis distribution stayed the same, a recovery to that line would put about half the capital back in profit. Coins changing hands along the way can move the ribbon.
From the speaker’s rounded $64,000 reference, reaching $81,600 would require a gain of about 27.5%. The video identifies a reason that recovery could face selling pressure. Someone who held through the fall might welcome the chance to exit near their entry. The chart locates that incentive. Actual sell orders would have to appear for it to become resistance.
04 / Realized losses
Who locked in the losses?
A week of selling below cost
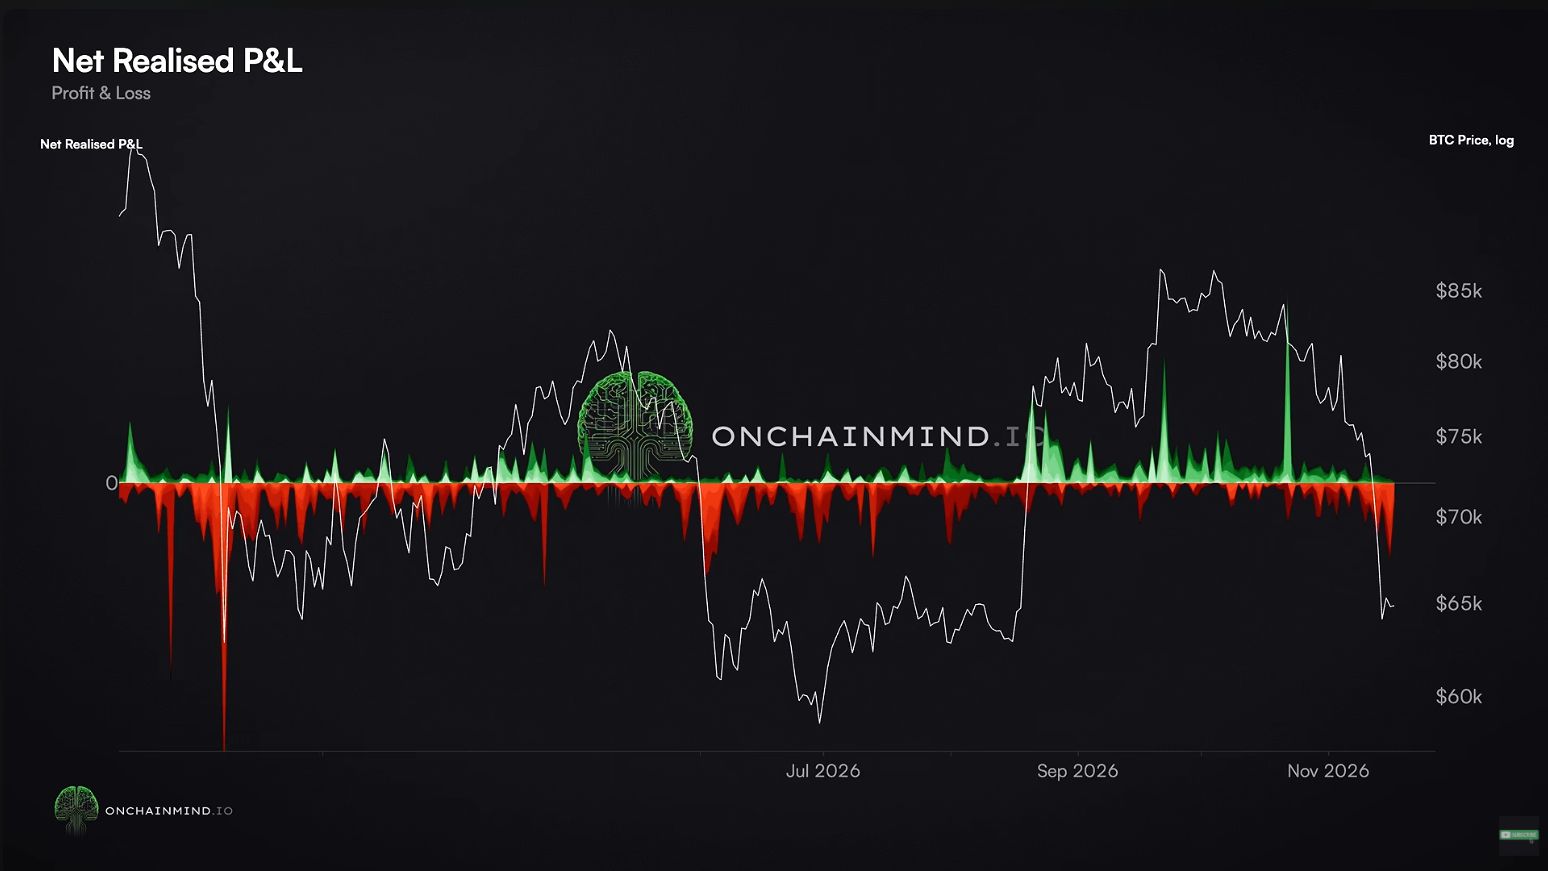
On November 16, coins moving below their prior on-chain cost basis generated more than $1.8 billion in gross realized losses. The presenter counted only 35 days in Bitcoin’s history with a larger nominal dollar loss. A dollar ranking is sensitive to the market’s growth, so the more revealing comparison is between losses and profits over the same week.
For the seven days through November 16, the video reports $5.8 billion of gross losses and $1.4 billion of gross profits. The difference was about $4.4 billion of net realized losses. The chart plots that daily net balance, which is why a red bar can be smaller than the gross losses cited for a day.
The youngest coins took the largest hit
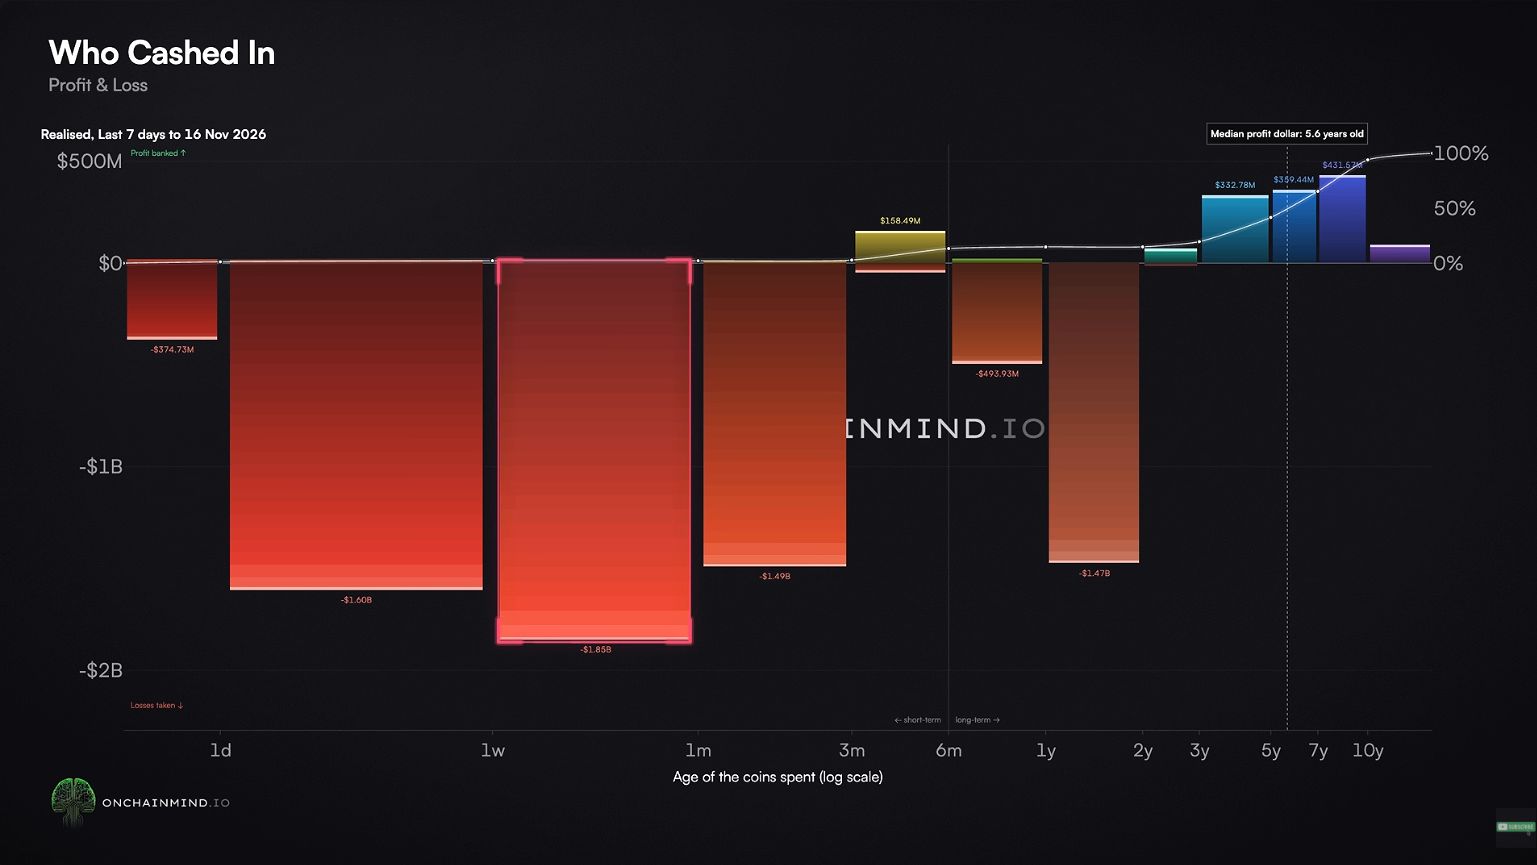
The presenter attributes about 71% of losses to coins held for less than six months. The largest individual band was one week to one month. Those coins moved at an average loss of nearly 20%, consistent with buyers entering a rally and exiting when the advance reversed.
Coin age measures the time since the last on-chain move. It gives a useful picture of which cost bases came under pressure, even though one investor can hold coins in several age bands.
05 / Holder behavior
Two groups realized losses at 3.4 times their usual pace
The recent buyer and the patient seller
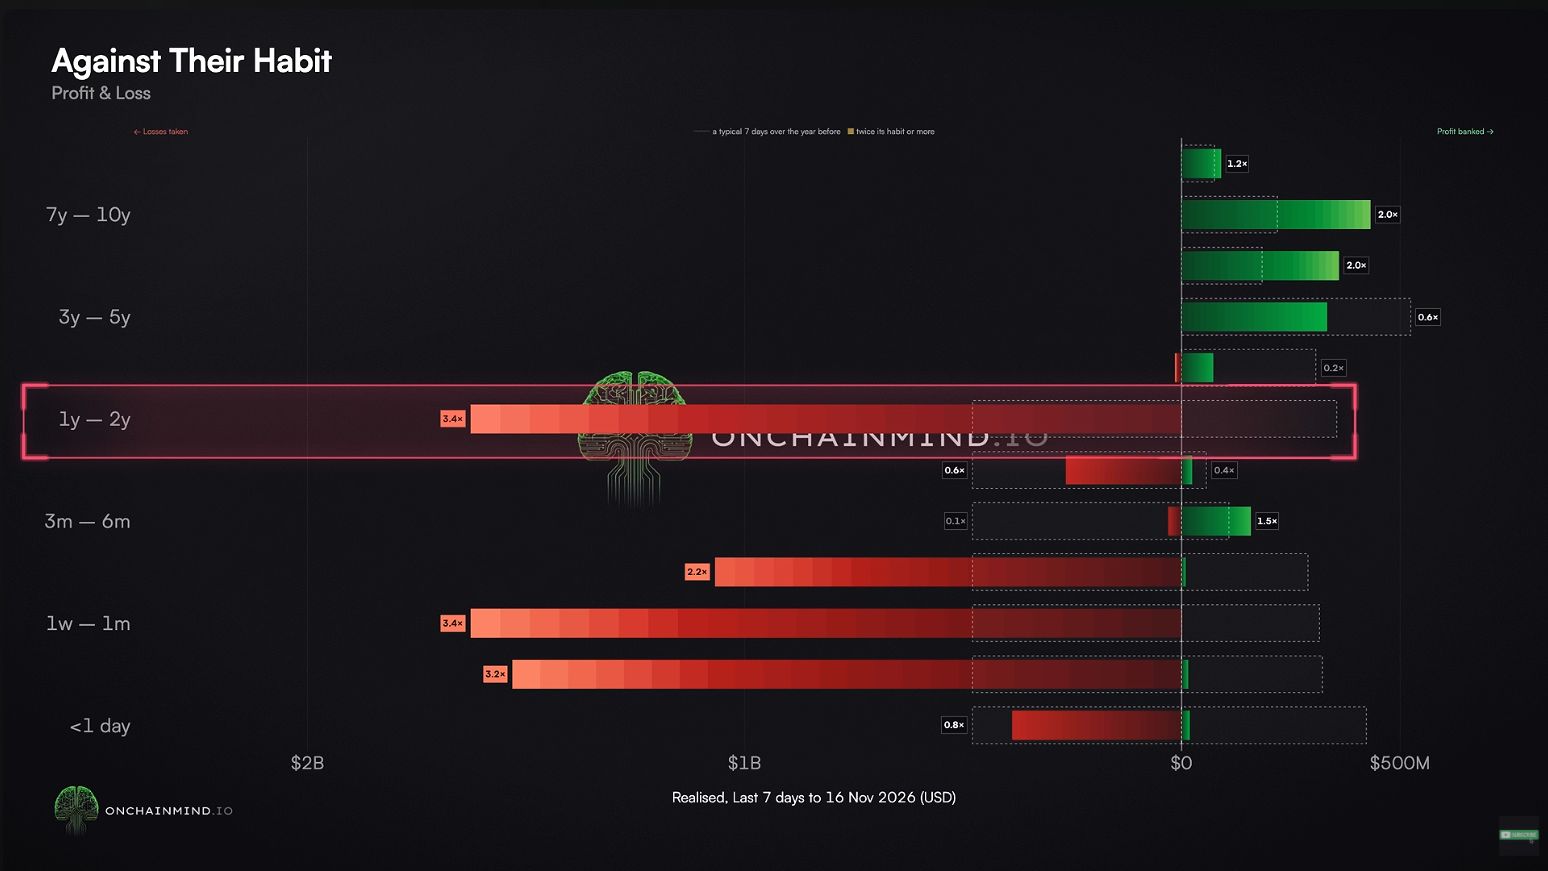
A large loss total can come from a group that trades heavily every week. Comparing each group with its own history changes the question. Both the one-week to one-month band and the one- to two-year band realized roughly 3.4 times their usual weekly losses.
For the older of those two groups, the average loss on coins spent was around 37%. Their last moves fell roughly between November 2024 and November 2025. Some buyers had endured much of the decline before accepting a loss this large. The matching 3.4 multiples therefore tell two different stories. One group had held for weeks, the other through more than a year of price swings.
Older cost bases still had room
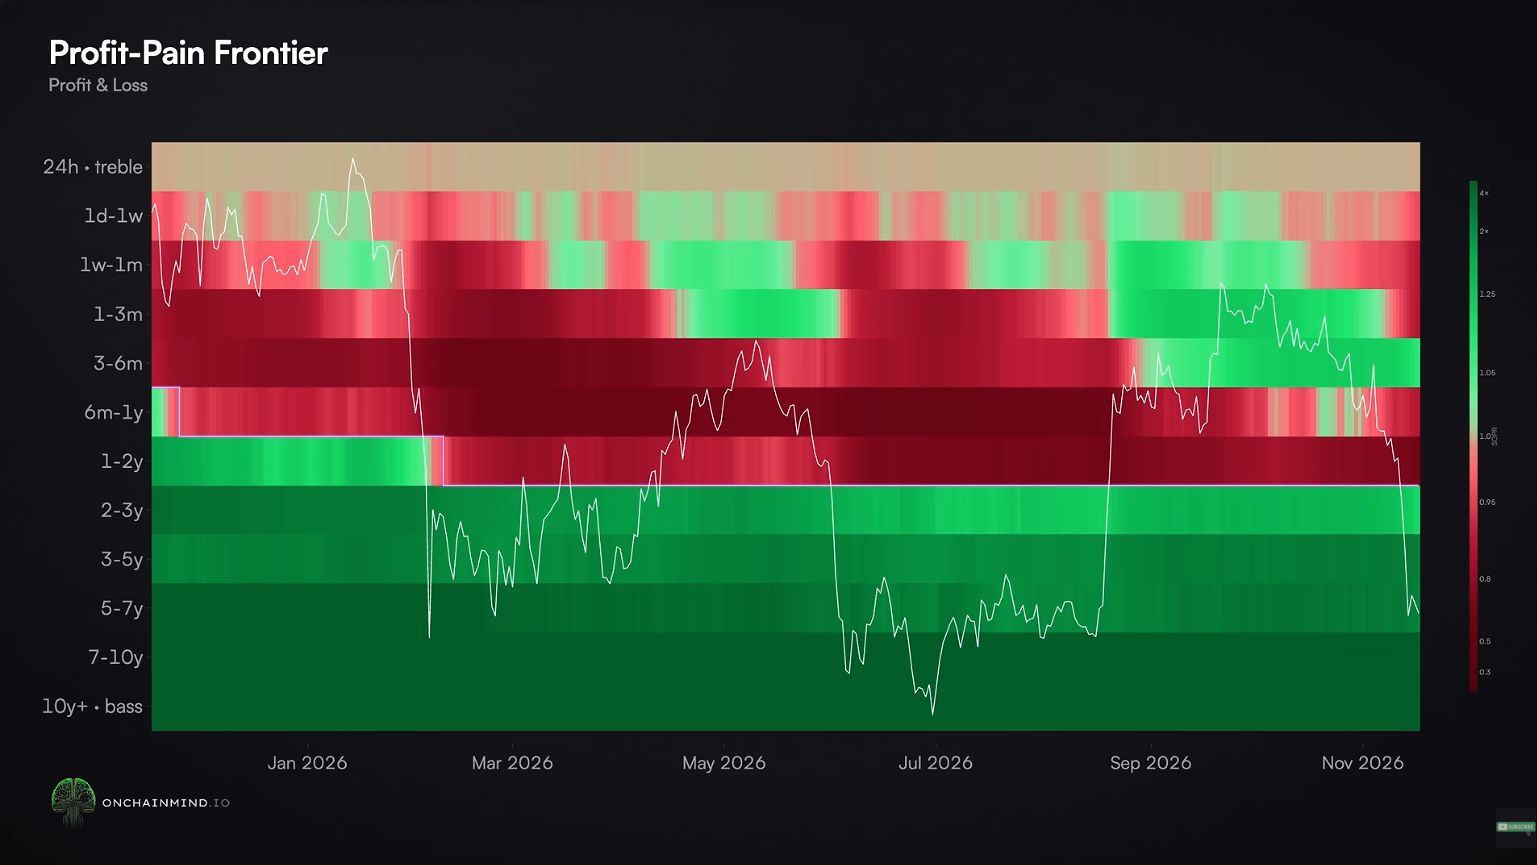
Coins older than three years accounted for about $1.1 billion of realized profit during the same week. Profit-taking continued without the surge in loss-taking visible among the two stressed groups. The deep green lower bands show why a falling market could still support profitable sales.
One example in the narration puts coins older than ten years that moved on the cited day at roughly 133 times their prior cost basis. It describes the coins that actually moved that day.
06 / Futures liquidations
Forced exits added a second wave of selling
Two days accounted for most of the damage
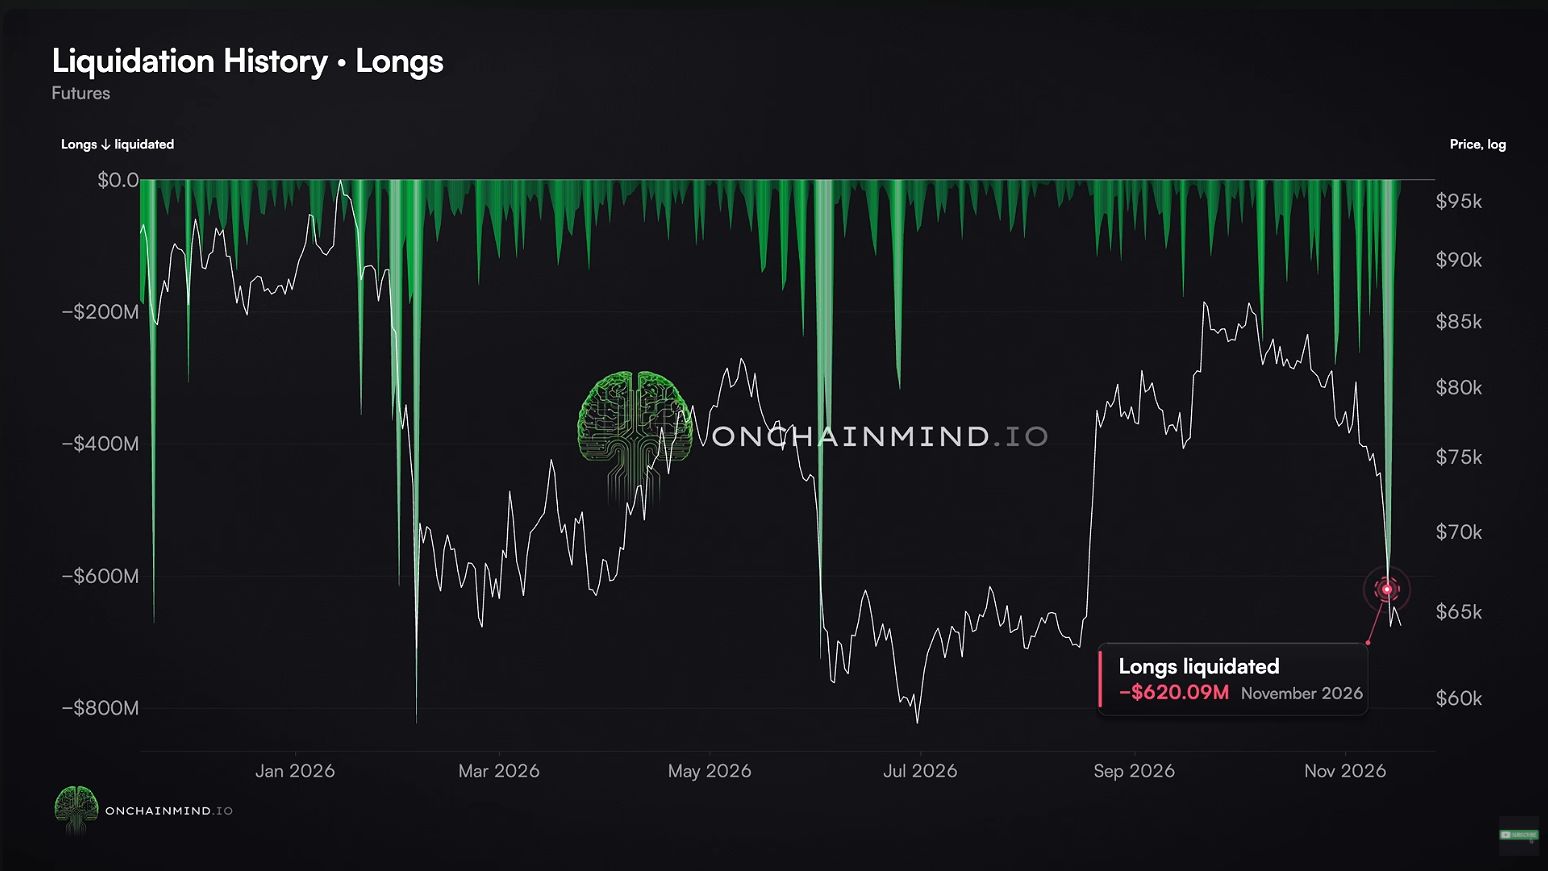
A leveraged long can be closed by an exchange once the trader’s collateral falls below the required level. The video reports about $620 million in long liquidations on November 13 and another $563 million on November 14. Those two days accounted for roughly two-thirds of the week’s $1.8 billion total.
Short liquidations were around $360 million for the week, making the long total about five times larger. These are the values of derivatives positions forcibly closed. Adding them to the on-chain realized losses would mix two different measurements.
How unusual was the unwind?
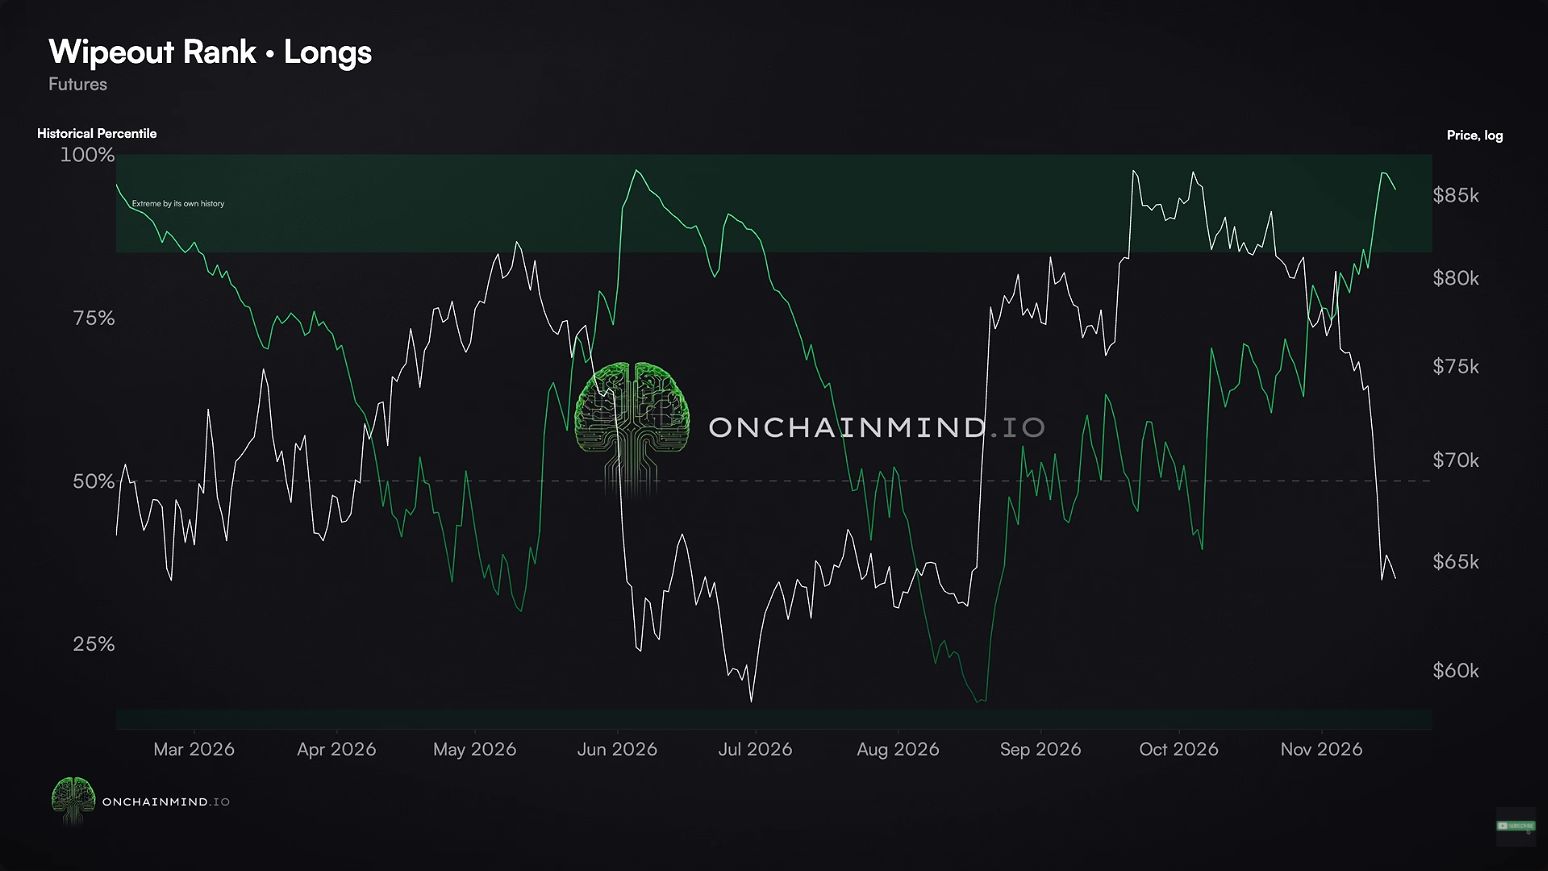
On-Chain Mind’s Wipeout Rank peaked at 97, meaning only about 3% of comparison days recorded larger long liquidations. In a separate comparison of the preceding 1,000 days, the presenter counted only five larger than November 13.
Bitcoin fell from roughly $75,000 on November 9 to $64,000 on November 14 with little interruption. The liquidation data give that price path a mechanism. Forced closures created sellers who had little discretion about when to exit.
07 / Open interest
How much futures exposure actually disappeared?
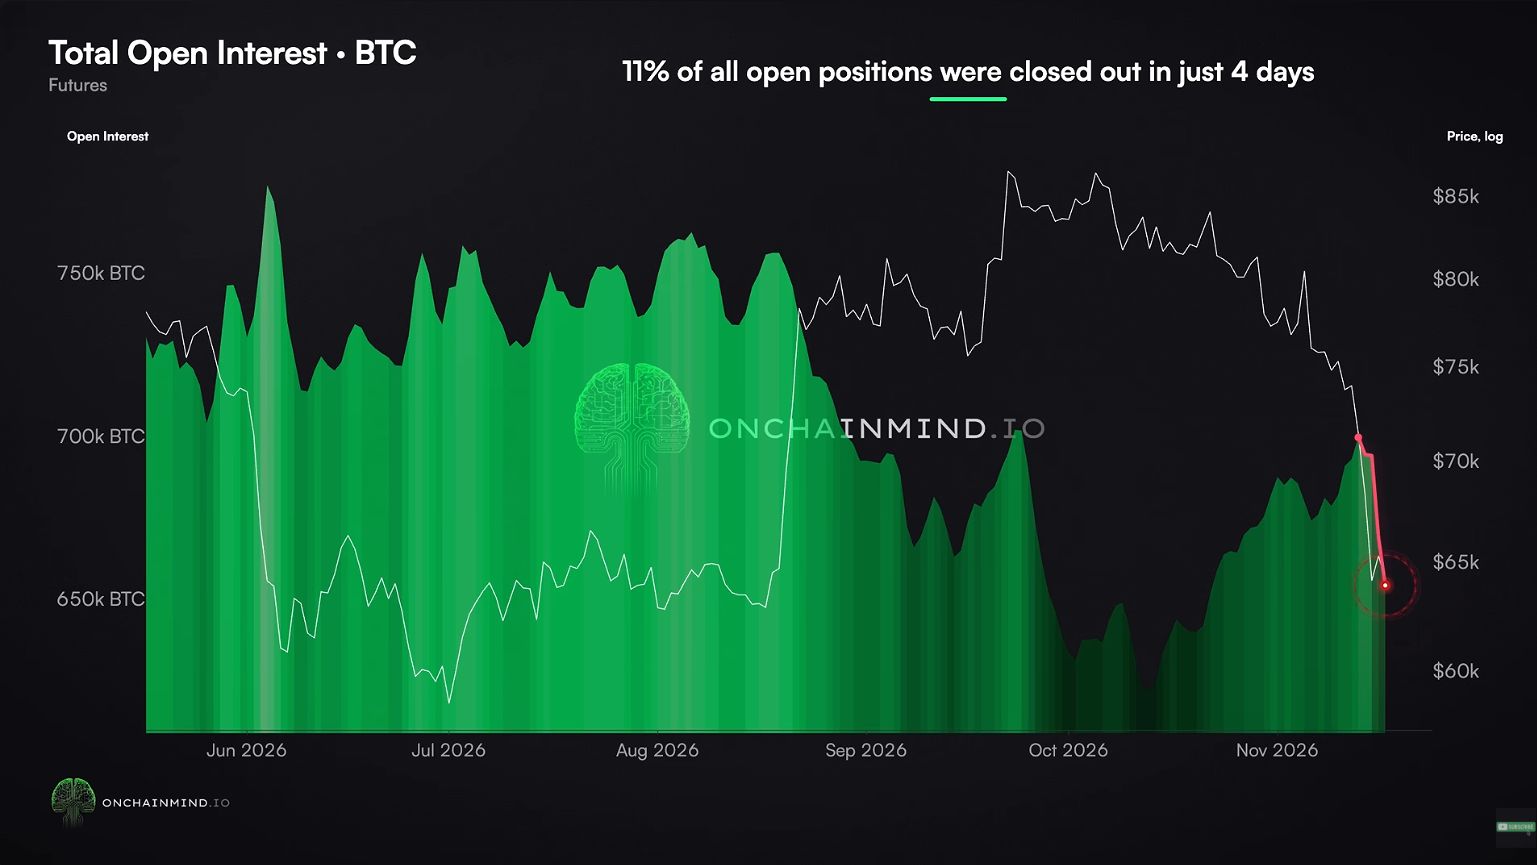
Dollar-denominated open interest can fall simply because Bitcoin gets cheaper. Expressing the outstanding futures exposure in BTC removes that direct price effect. In the video, the BTC measure first rose while the spot price was falling. Traders were still adding exposure into the decline.
The narrator gives a peak near 713,000 BTC on November 13 and a subsequent reading near 636,000 BTC. The difference of around 77,000 BTC amounts to a 10.8% contraction in four days. It measures the net reduction in outstanding exposure. Voluntary closures can contribute alongside liquidations, and every open contract has both a long and a short side.
08 / Sentiment
Extreme fear showed up in two different samples
Fear & Greed returned to June levels
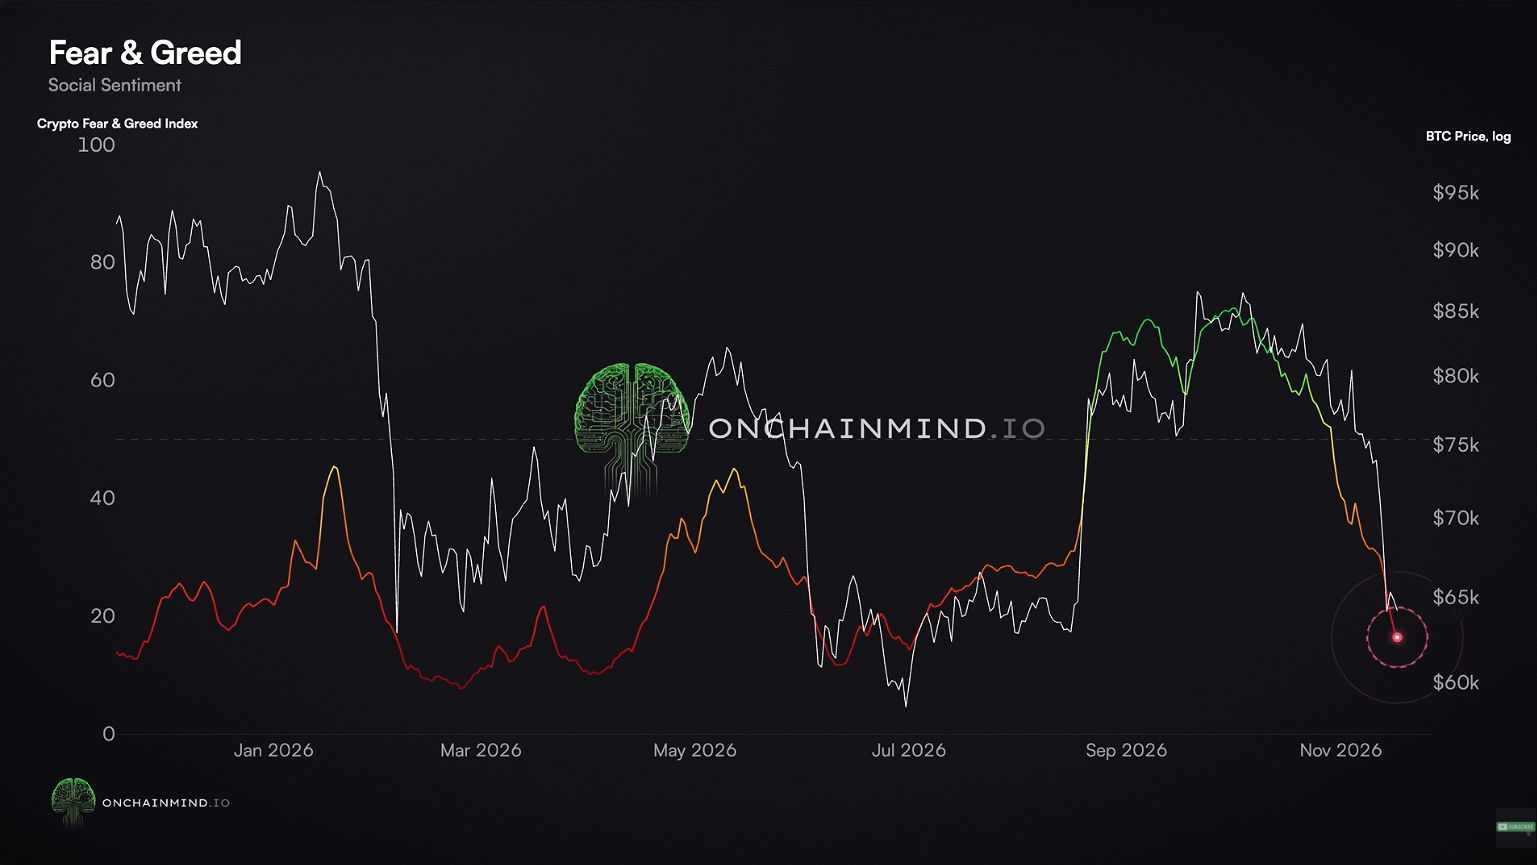
The Crypto Fear & Greed Index stood at 12 at recording, after readings of 10 on Sunday and Monday. The last comparable level cited was July 1, just after the late-June price low. In the presenter’s history going back to 2018, the index had closed at 12 or lower on fewer than 5% of days.
June offers a comparison for the intensity of fear. It gives much less guidance about how long that fear can persist, since consecutive low readings can belong to the same sell-off.
X sentiment reached the fourth percentile
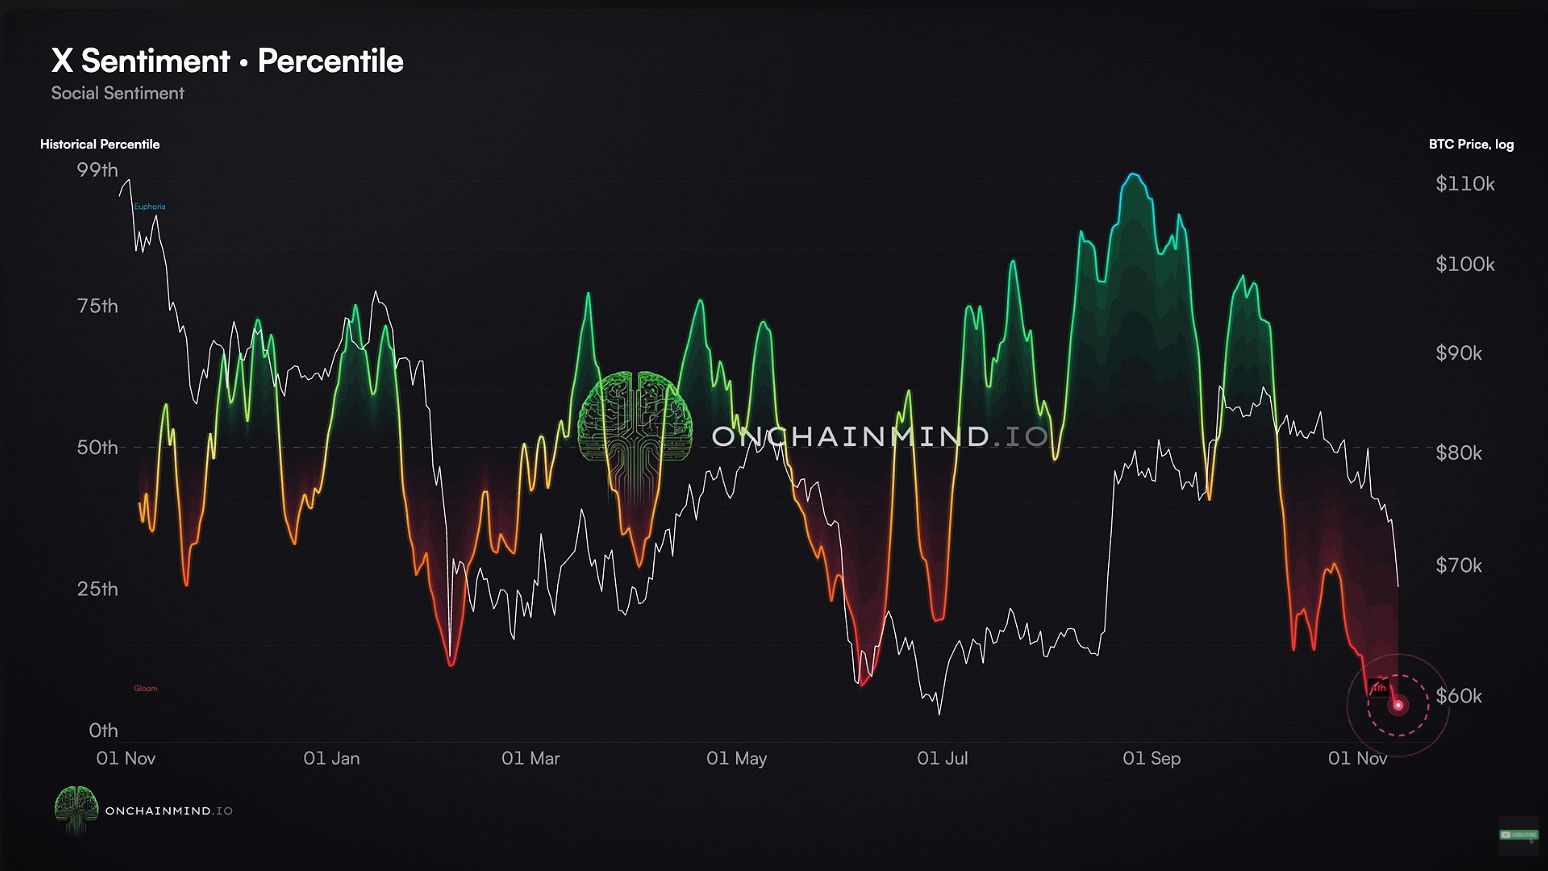
On-Chain Mind had analyzed more than 132,000 posts from analysts and retail accounts and was extending its history backward. Its fourth-percentile reading was the lowest the presenter had observed in the available series, which then covered a little over a year.
The X series therefore describes this bear market especially well. Its short history offers a much narrower comparison than the Fear & Greed Index.
09 / Omega Score
The cycle score fell to 19 and the short-term score to 9
The slower cycle measure
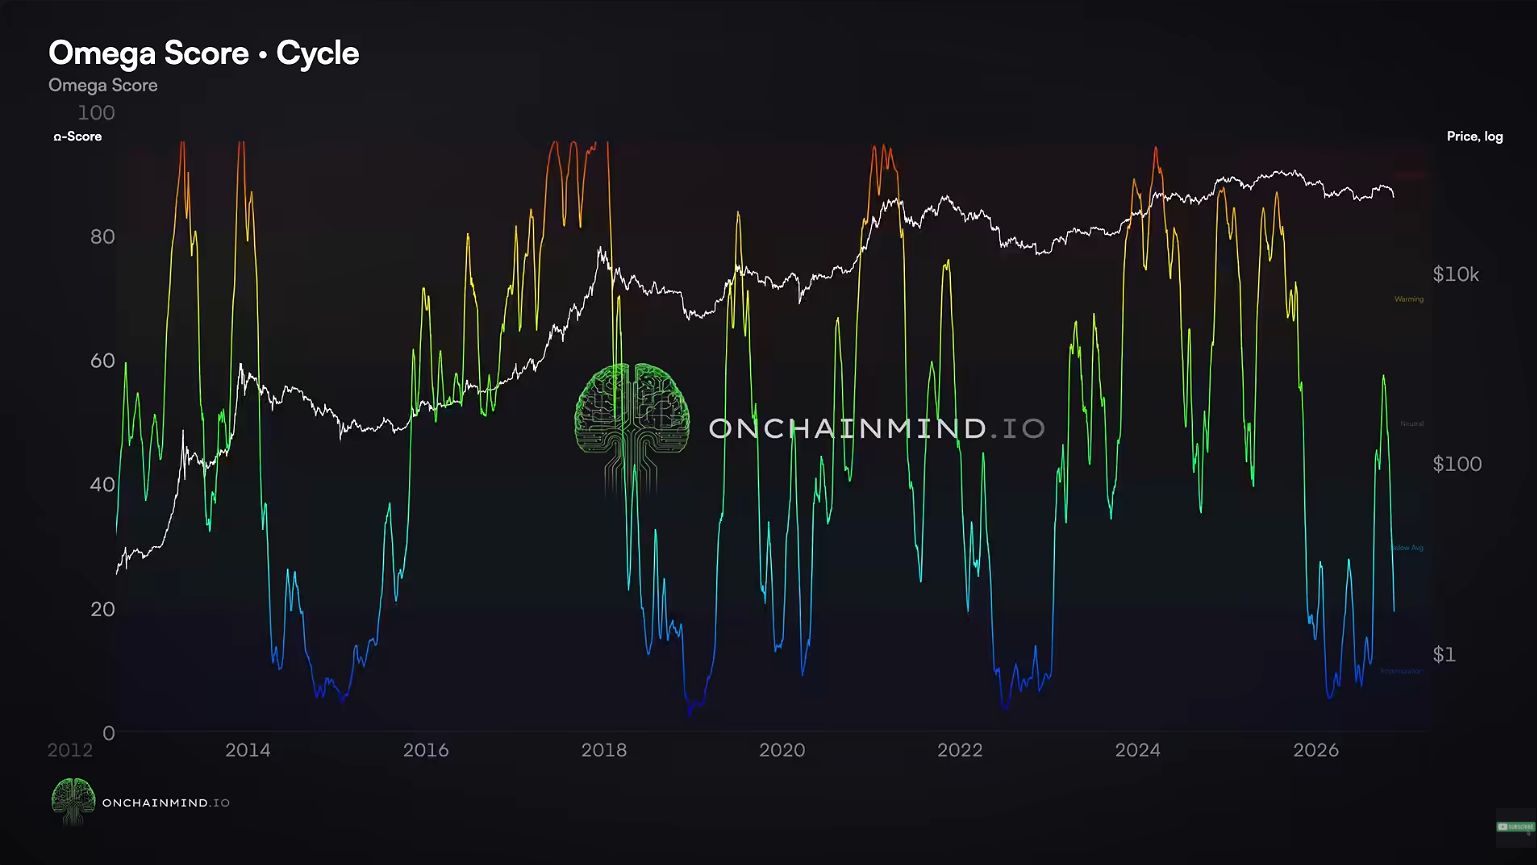
On-Chain Mind’s proprietary cycle score fell from about 50 a month earlier to 19 out of 100, putting it in the platform’s deep accumulation zone. The shift matters within the author’s strategy because low cycle scores are where he considers increasing the pace of purchases over time.
A reading of 19 is a model score. Translating that number into a 19% probability of loss would require a separate statistical test. The video examines subsequent returns separately.
The faster measure reversed in three months
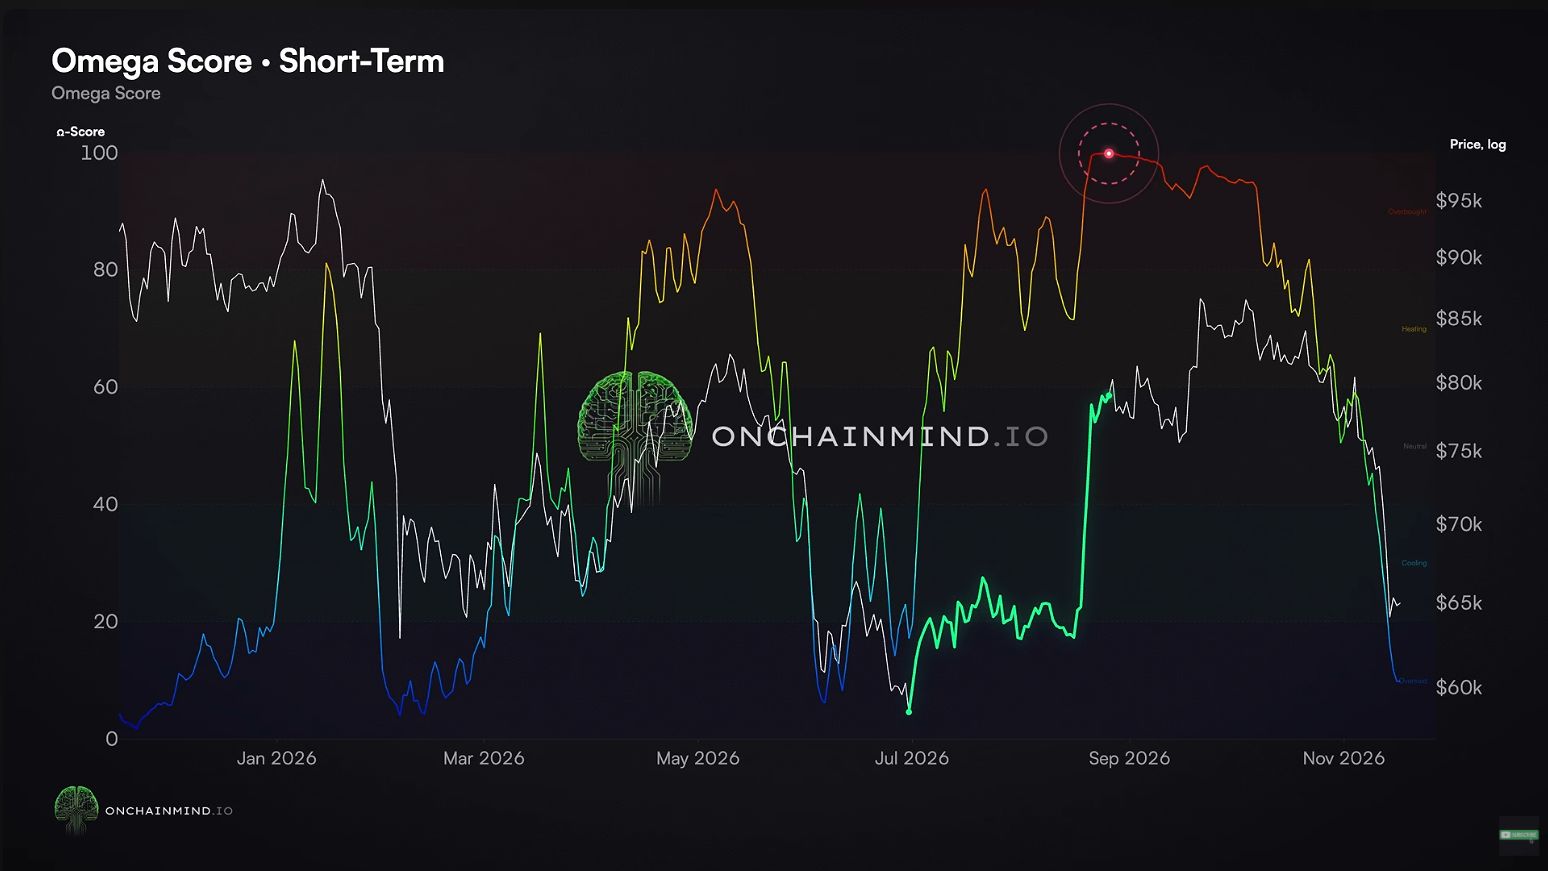
The short-term version reached the high 90s in late August as Bitcoin rallied off its June low. By the recording it had fallen to 9. In less than three months the same indicator had classified the advance as unusually stretched and the subsequent decline as heavily oversold.
The presenter uses this faster reading to describe how abruptly conditions changed. A low reading can persist through further declines.
10 / Holding period
What happened after buying on an arbitrary day?
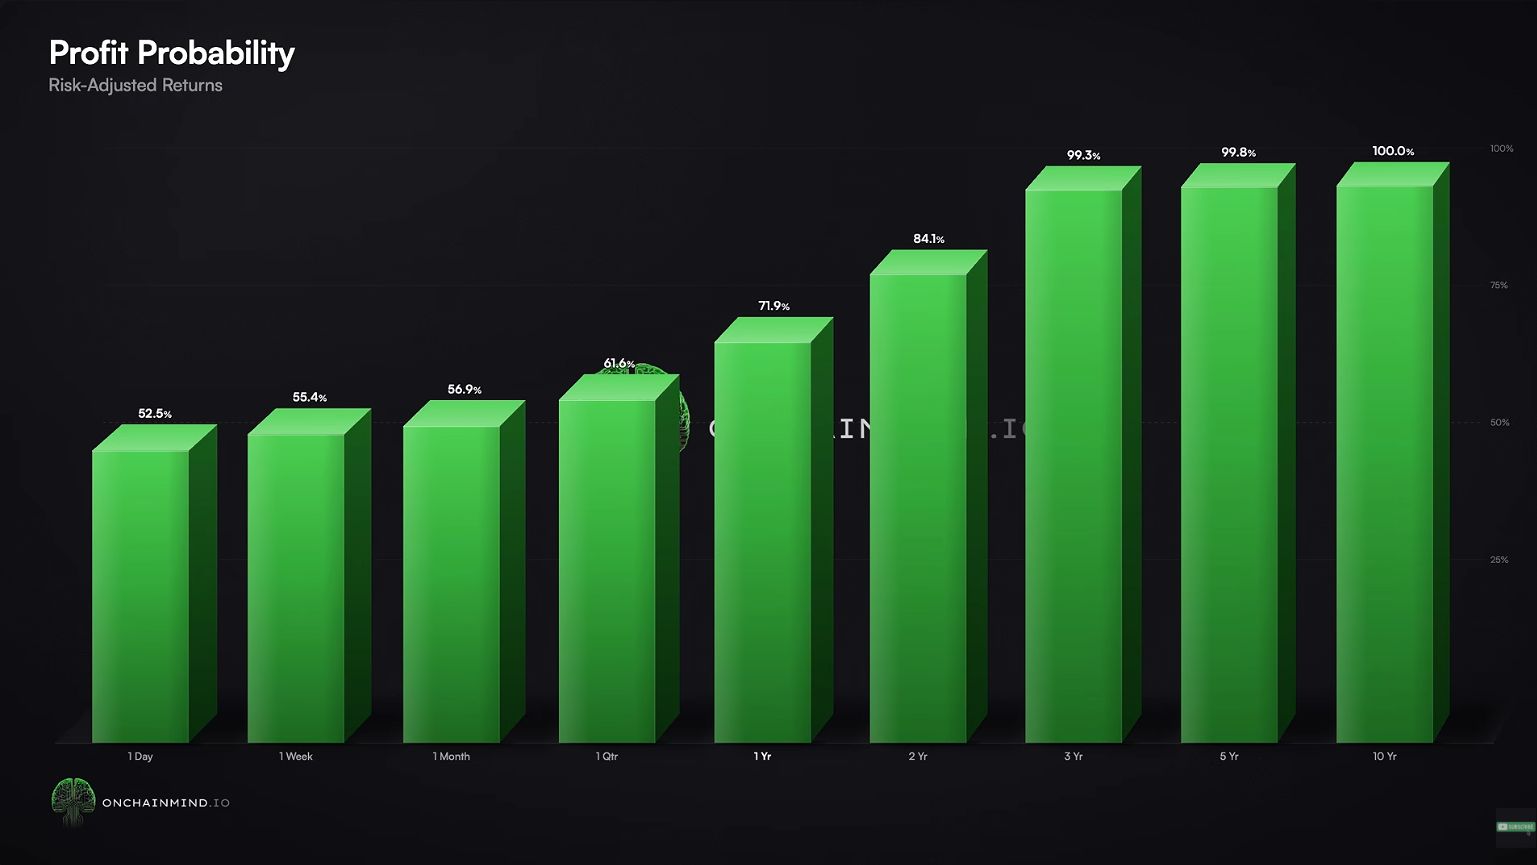
The first historical test ignores the Omega Score and uses every eligible entry date. The share finishing in profit was 52.5% after one day, 71.9% after one year, 84.1% after two years and 99.3% after three. A trader needing liquidity in a few weeks faced a very different historical distribution from someone able to wait three years.
A positive ending price says nothing about the worst point along the way. Also, adjacent entry dates share most of the same holding period. Many profitable three-year windows can reflect a single long advance. The percentages describe Bitcoin’s observed history and supply the baseline for the next comparison.
11 / Historical outcomes
What changed when the starting Omega Score was low?
Twelve months still left material downside
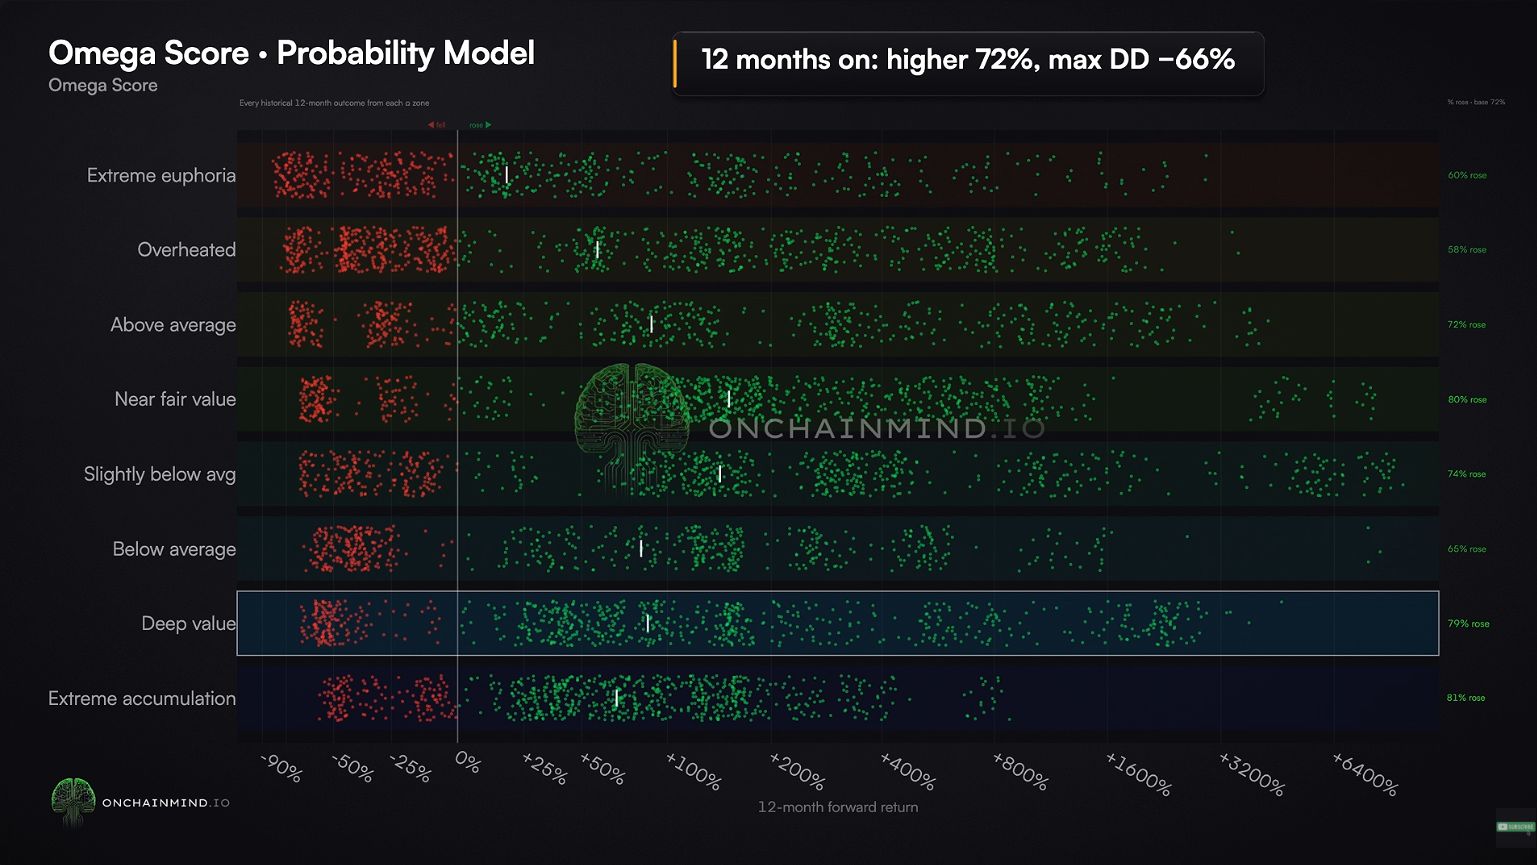
The second test starts from historical observations with cycle readings comparable to 19. The presenter reports a higher BTC price after 12 months in 72% of those observations and a worst drawdown of approximately 66%. A favorable starting valuation still allowed for a large loss.
The upper annotation supplies the 72% figure discussed in the narration. The highlighted Deep value row on the scatter itself reads 79%, while the chart-wide base rate reads 72%. The video does not reconcile those figures or give a count of independent episodes, so the speaker’s 72% deserves caution.
The two-year comparison was stronger
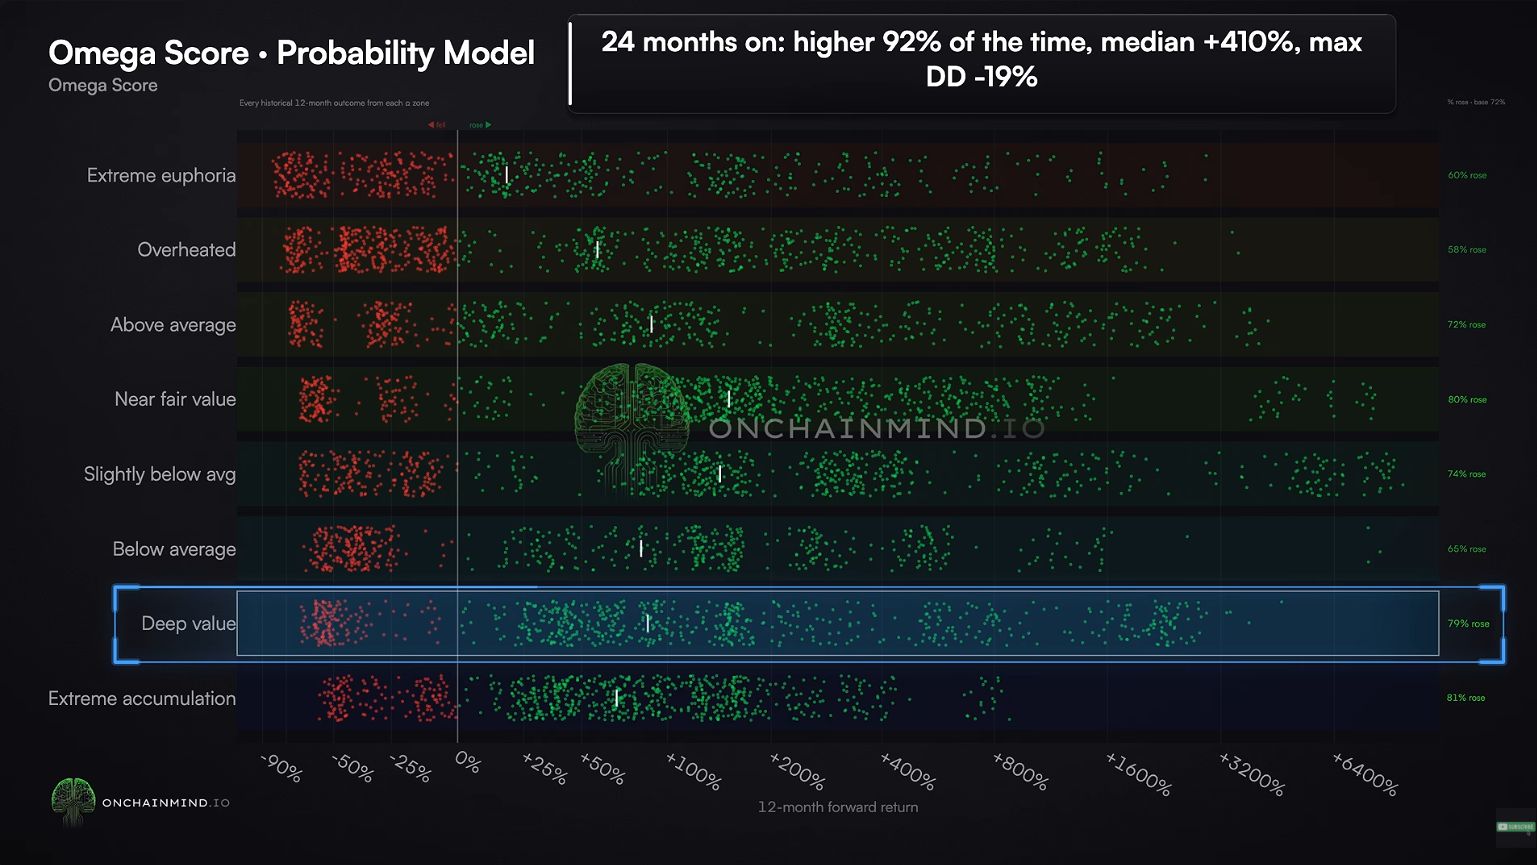
For the 24-month comparison, the speaker reports a higher ending price in 92% of cases and a median gain near 410%. He also cites a 19% maximum drawdown for that view. The video does not establish how the two drawdown samples were constructed, so 19% cannot serve as a downside limit on a new position.
The 92% figure and the median answer different questions. One counts profitable outcomes. The other describes the middle return among the observations. Neither establishes the return a buyer in November 2026 will earn.
12 / Conclusion
A capitulation reading can outlast the sell-off that produced it
The clearest evidence of capitulation was in what holders and exchanges actually did. Coins last moved near the rally changed hands below cost, one- to two-year coins realized unusually large losses, and futures exposure contracted by roughly a tenth. Sentiment echoed behavior already visible in those transactions.
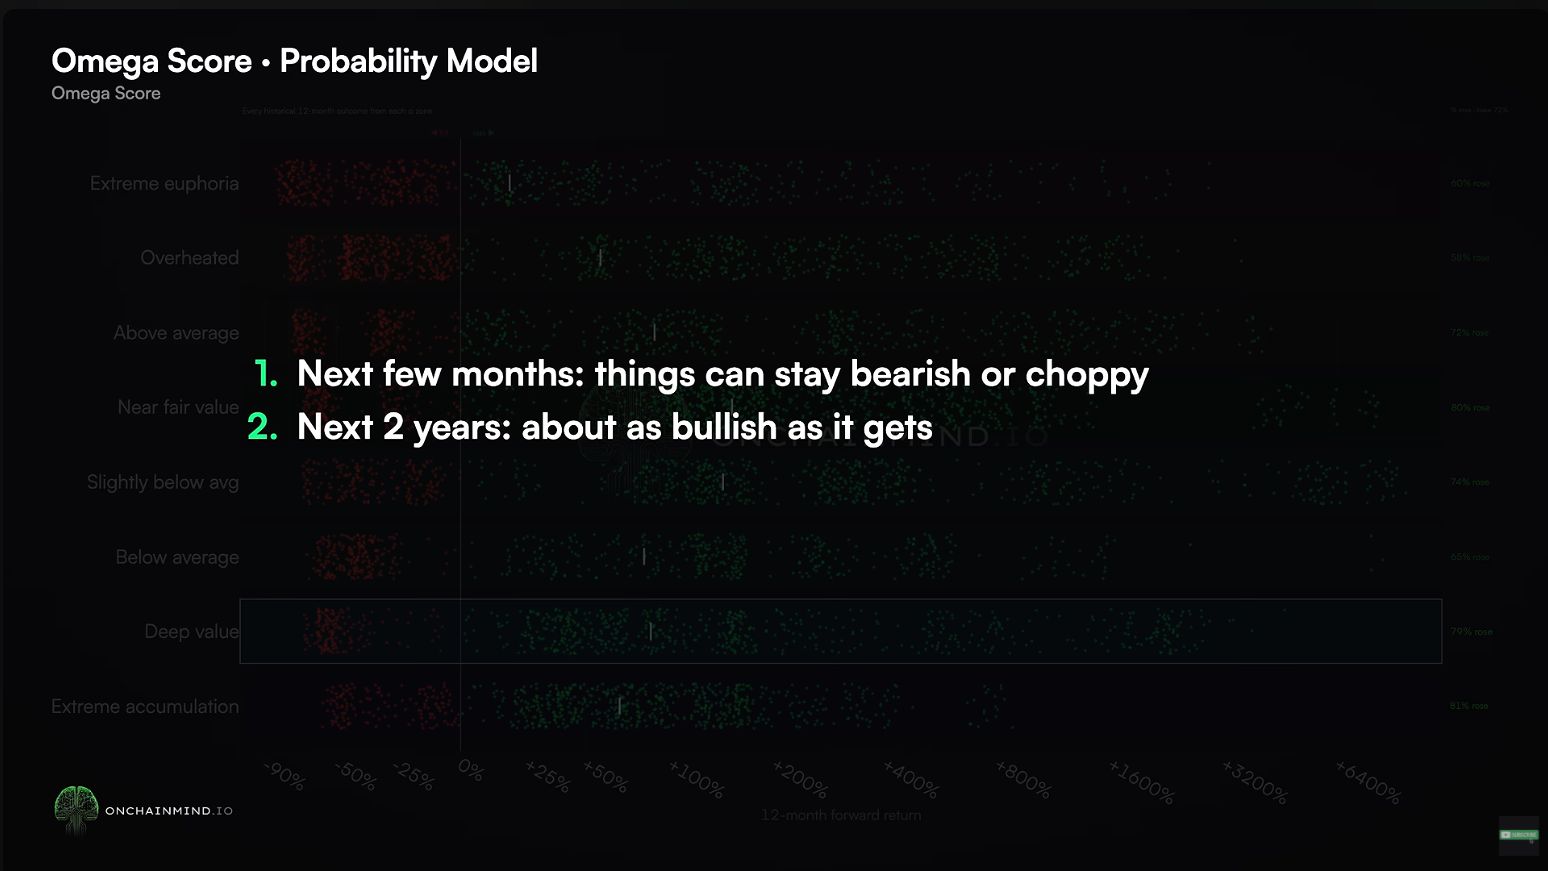
The speaker’s conclusion depends on the investor’s time horizon. A buyer who needs the money soon still faces the possibility of months of weakness. Someone accumulating over years can use the same evidence to plan purchases in stages and leave room for a lower price. The June close and the $81,600 ribbon give that plan two concrete references while the market decides whether November marked a lasting low.
#BTC #on-chain #realized losses #futures liquidations #market sentiment #Omega




No comments yet
Be the first to share your perspective.